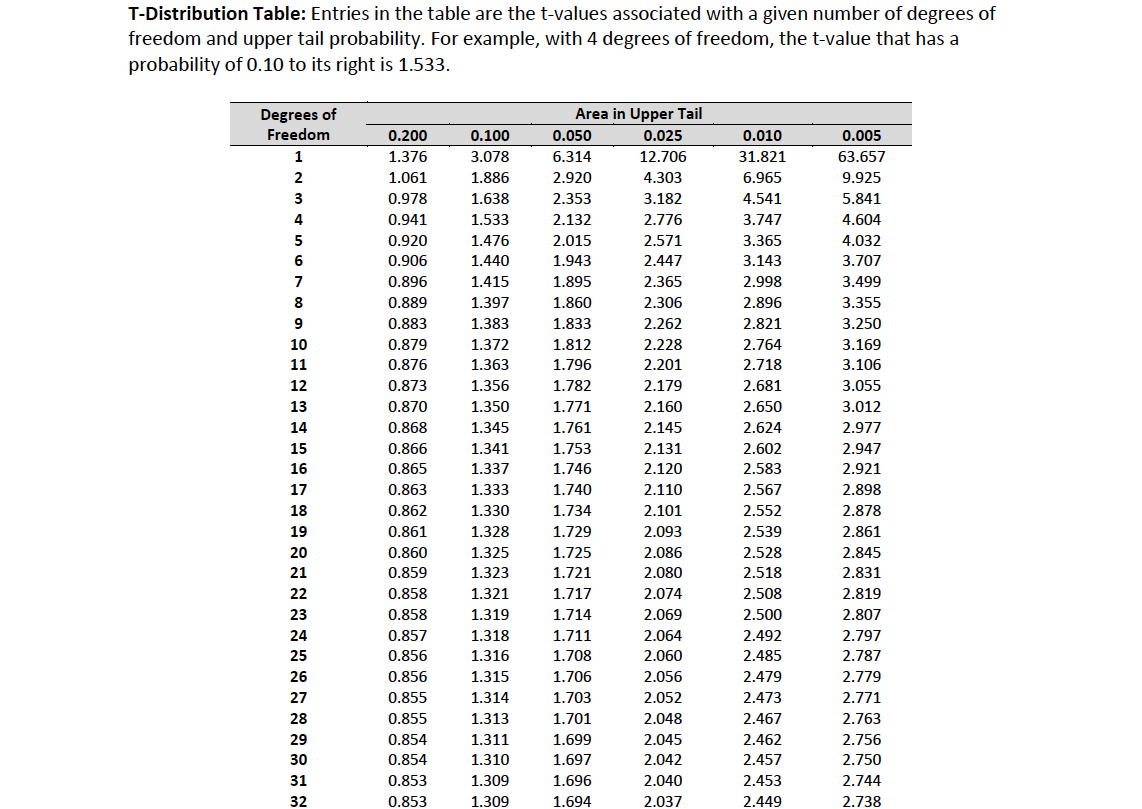
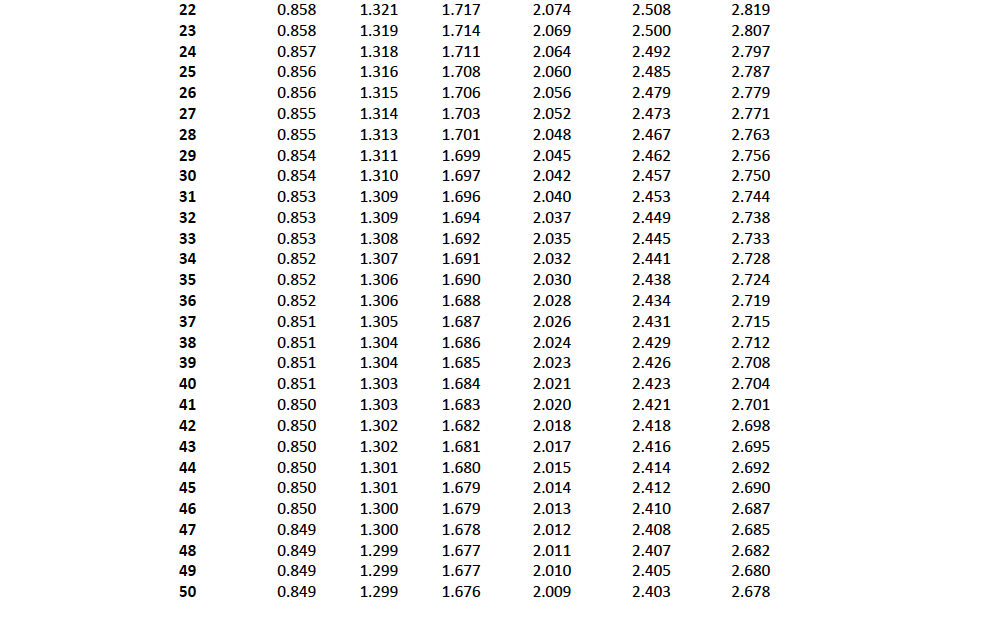
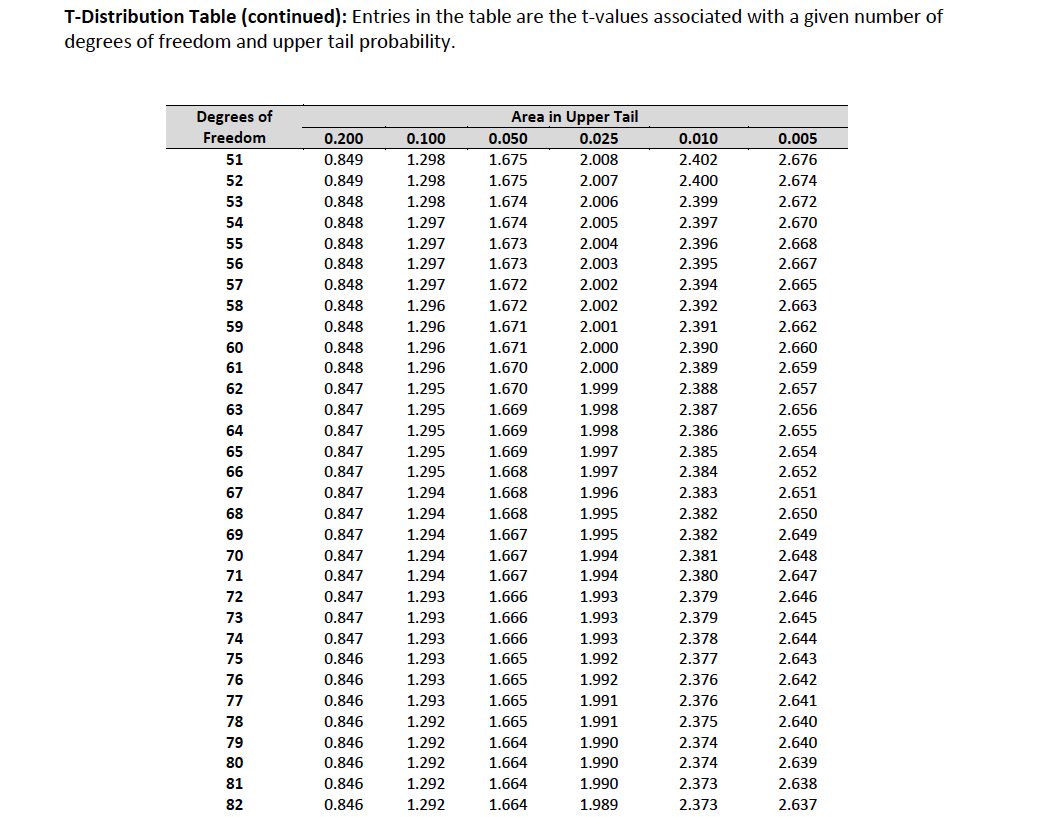
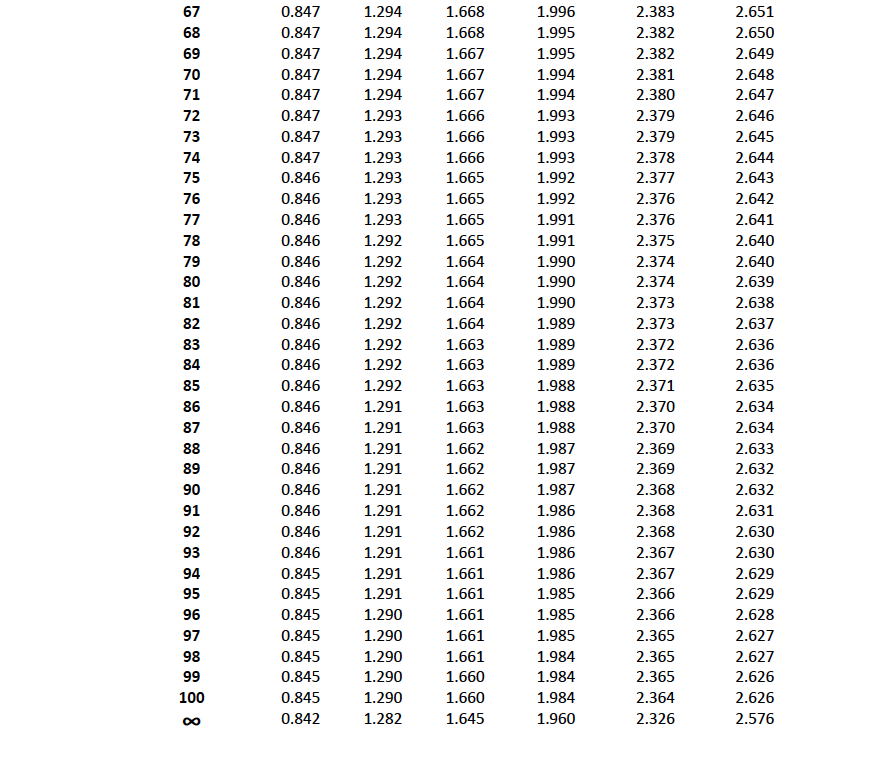
The table is for the t dist question
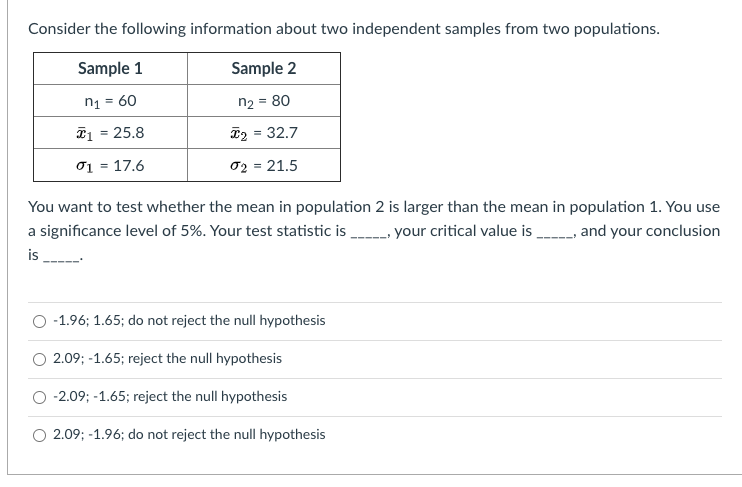
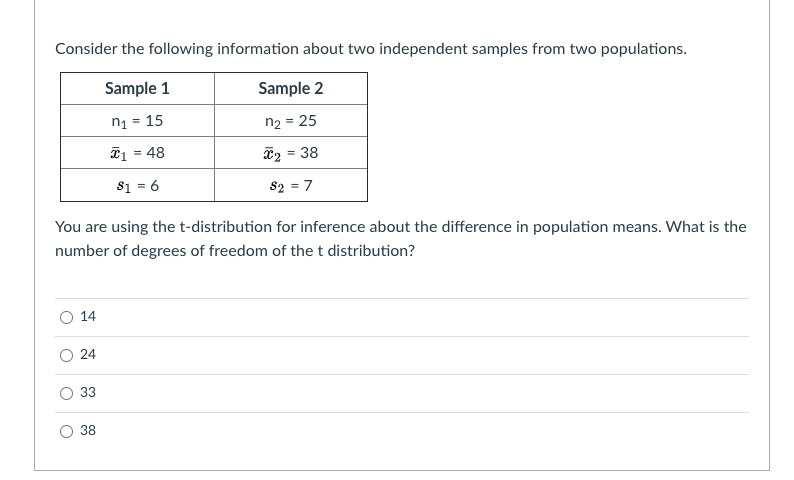
Consider the following information about two independent samples from two populations. Sample 1 Sample 2 n1 = 60 no = 80 C1 = 25.8 To = 32.7 71 = 17.6 02 = 21.5 You want to test whether the mean in population 2 is larger than the mean in population 1. You use a significance level of 5%. Your test statistic is your critical value is _; and your conclusion is O -1.96; 1.65; do not reject the null hypothesis O 2.09; -1.65; reject the null hypothesis O -2.09; -1.65; reject the null hypothesis O 2.09; -1.96; do not reject the null hypothesisConsider the following information about two independent samples from two populations. You are using the t-distribution for inference about the difference in population means. What is the number of degrees of freedom of the t distribution? C) 14 {3.24 C) 33 gas T-Distribution Table: Entries in the table are the tvalues associated with a given number of degrees of freedom and upper tail probability. For example, with 4 degrees of freedom, the tValue that has a probability of 0.10 to its right is 1.533. Degrees of Area in Upper Tail Freedom 0.200 0.100 0.050 0.025 0.010 0.005 1 1.326 3.028 6.314 12.206 31.821 63.652 2 1.061 1.886 2.920 4.303 6.965 9.925 3 0.928 1.638 2.353 3.182 4.541 5.841 4 0.941 1.533 2.132 2.226 3.242 4.604 5 0.920 1.426 2.015 2.521 3.365 4.032 6 0.906 1.440 1.943 2.442 3.143 3.202 2 0.896 1.415 1.895 2.365 2.998 3.499 8 0.889 1.392 1.860 2.306 2.896 3.355 9 0.883 1.383 1.833 2.262 2.821 3.250 10 0.829 1.322 1.812 2.228 2.264 3.169 11 0.826 1.363 1.296 2.201 2.218 3.106 12 0.823 1.356 1.282 2.129 2.681 3.055 13 0.820 1.350 1.221 2.160 2.650 3.012 14 0.868 1.345 1.261 2.145 2.624 2.922 15 0.866 1.341 1.253 2.131 2.602 2.942 16 0.865 1.332 1.246 2.120 2.583 2.921 12' 0.863 1.333 1.240 2.110 2.562 2.898 18 0.862 1.330 1.234 2.101 2.552 2.828 19 0.861 1.328 1.229 2.093 2.539 2.861 20 0.860 1.325 1.225 2.086 2.528 2.845 21 0.859 1.323 1.221 2.080 2.518 2.831 22 0.858 1.321 1.212 2.024 2.508 2.819 23 0.858 1.319 1.214 2.069 2.500 2.802 24 0.852 1.318 1.211 2.064 2.492 2.292 25 0.856 1.316 1.208 2.060 2.485 2.282 26 0.856 1.315 1.206 2.056 2.429 2.229 22' 0.855 1.314 1.203 2.052 2.423 2.221 28 0.855 1.313 1.201 2.048 2.462 2.263 29 0.854 1.311 1.699 2.045 2.462 2.256 30 0.854 1.310 1.692 2.042 2.452 2.250 31 0.853 1.309 1.696 2.040 2.453 2.244 32 0.853 1.309 1.694 2.032 2.449 2.238 \fT-Distribution Table (continued): Entries in the table are the tvalues associated with a given number of degrees of freedom and upper tail probability. Degrees of Area in Upper Tail Freedom 0.200 0.100 0.050 0.025 0.010 0.005 51 0. 849 1. 298 1.675 2.008 2.402 2.676 52 0.849 1.298 1.675 2.00? 2.400 2.674 53 0. 848 1.298 1.674 2.006 2.399 2.672 54 0. 848 1.29? 1.674 2.005 2.39? 2.670 55 0. 848 1.29? 1.673 2.004 2.396 2.668 56 0.848 1.29? 1.673 2.003 2.395 2.66? 57 0. 848 1.29? 1.672 2.002 2.394 2.665 58 0. 848 1.296 1.672 2.002 2.392 2.663 59 0. 848 1. 296 1.671 2.001 2.391 2.662 60 0. 848 1.296 1.671 2.000 2.390 2.660 61 0. 848 1. 296 1.670 2.000 2.389 2.659 62 0.847 1.295 1.670 1.999 2.388 2.657 63 0.84? 1.295 1.669 1.998 2.38? 2.656 64 0.847 1.295 1.669 1.998 2.386 2.655 65 0.84? 1.295 1.669 1.99? 2.385 2.654 66 0.847 1.295 1.668 1.997 2.384 2.652 67 0. 84? 1. 294 1.668 1.996 2.383 2.65 1 68 0.84? 1.294 1.663 1.995 2.382 2.650 69 0.847 1.294 1.667 1.995 2.382 2.649 70 0. 84? 1. 294 1.667 1.994 2.381 2.648 71 0. 847 1. 294 1.667 1.994 2.380 2.647 72 0.84? 1.293 1.666 1.993 2.3?9 2.646 73 0.847 1.293 1.666 1.993 2.379 2.645 74 0.84? 1.293 1.666 1.993 2.3?8 2.644 75 0.846 1.293 1.665 1.992 2.377 2.643 76 0.846 1.293 1.665 1.992 2.3?6 2.642 77 0. 846 1. 293 1.665 1.991 2.3?6 2.64 1 78 0. 846 1. 292 1.665 1.991 2.3?5 2.640 79 0.846 1.292 1.664 1.990 2.374 2.640 80 0.846 1.292 1.664 1.990 2.3?4 2.639 81 0. 846 1. 292 1.664 1.990 2.3?3 2.638 82 0. 846 1. 292 1.664 1.989 2.373 2.637 \f
