

Answered step by step
Verified Expert Solution
Question
1 Approved Answer
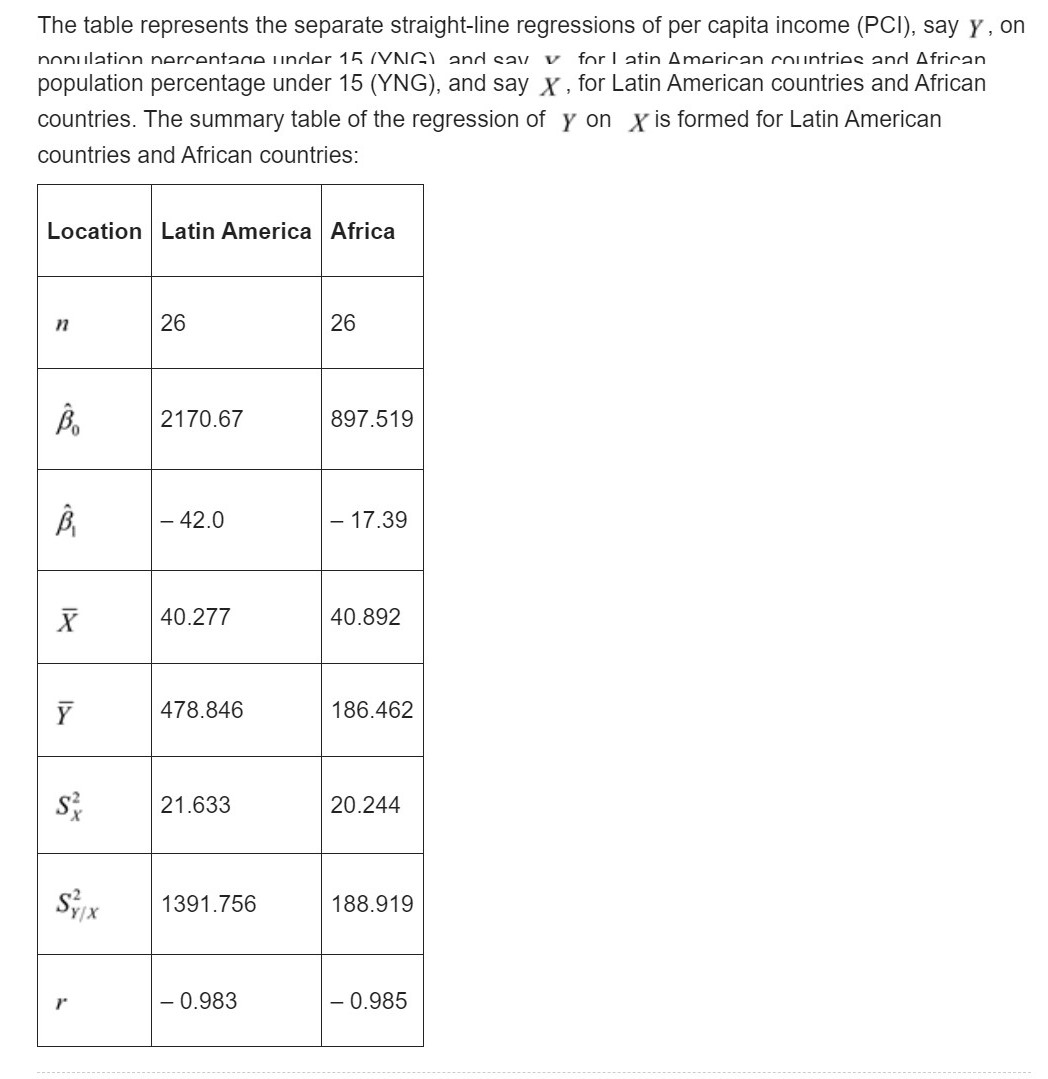
The table represents the separate straight-line regressions of per capita income (PCI), say y , on nonuilation nerrentane under 15 /VMG) and cav v for
Step by Step Solution
There are 3 Steps involved in it
Step: 1

Get Instant Access to Expert-Tailored Solutions
See step-by-step solutions with expert insights and AI powered tools for academic success
Step: 2

Step: 3
Ace Your Homework with AI
Get the answers you need in no time with our AI-driven, step-by-step assistance
Get Started
Contemporary Business Mathematics With Canadian Applications
Authors: Ali R. Hassanlou, S. A. Hummelbrunner, Kelly Halliday
12th Edition
0135285011, 978-0135285015