

Question
The table shows population statistics for the ages of Best Actor and Best Supporting Actor winners at an awards ceremony. The distributions of the ages
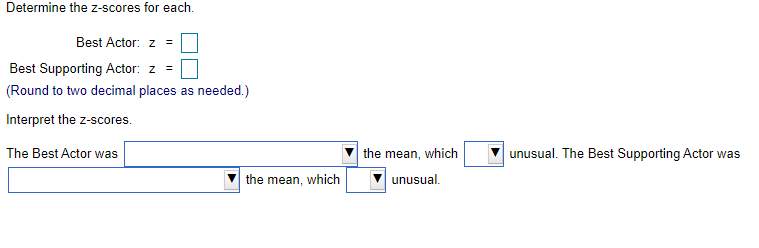
The table shows population statistics for the ages of Best Actor and Best Supporting Actor winners at an awards ceremony. The distributions of the ages are approximately?bell-shaped. Compare the?z-scores for the actors in the following situation.
Best Actor
?=46.0
?=7.3
Best Supporting Actor
?=49.0
?=13
In a particular?year, the Best Actor was 64 years old and the Best Supporting Actor was 46 years old.
Step by Step Solution
There are 3 Steps involved in it
Step: 1

Get Instant Access to Expert-Tailored Solutions
See step-by-step solutions with expert insights and AI powered tools for academic success
Step: 2

Step: 3
Ace Your Homework with AI
Get the answers you need in no time with our AI-driven, step-by-step assistance
Get Started
Quantitative Analysis For Management
Authors: Barry Render, Ralph M. Stair, Michael E. Hanna
11th Edition
9780132997621, 132149117, 132997622, 978-0132149112