Answered step by step
Verified Expert Solution
Link Copied!

Question

1 Approved Answer

The table shows the amounts of crude oil (in thousands of barrels per day) produced by a certain country and the amounts of crude oil
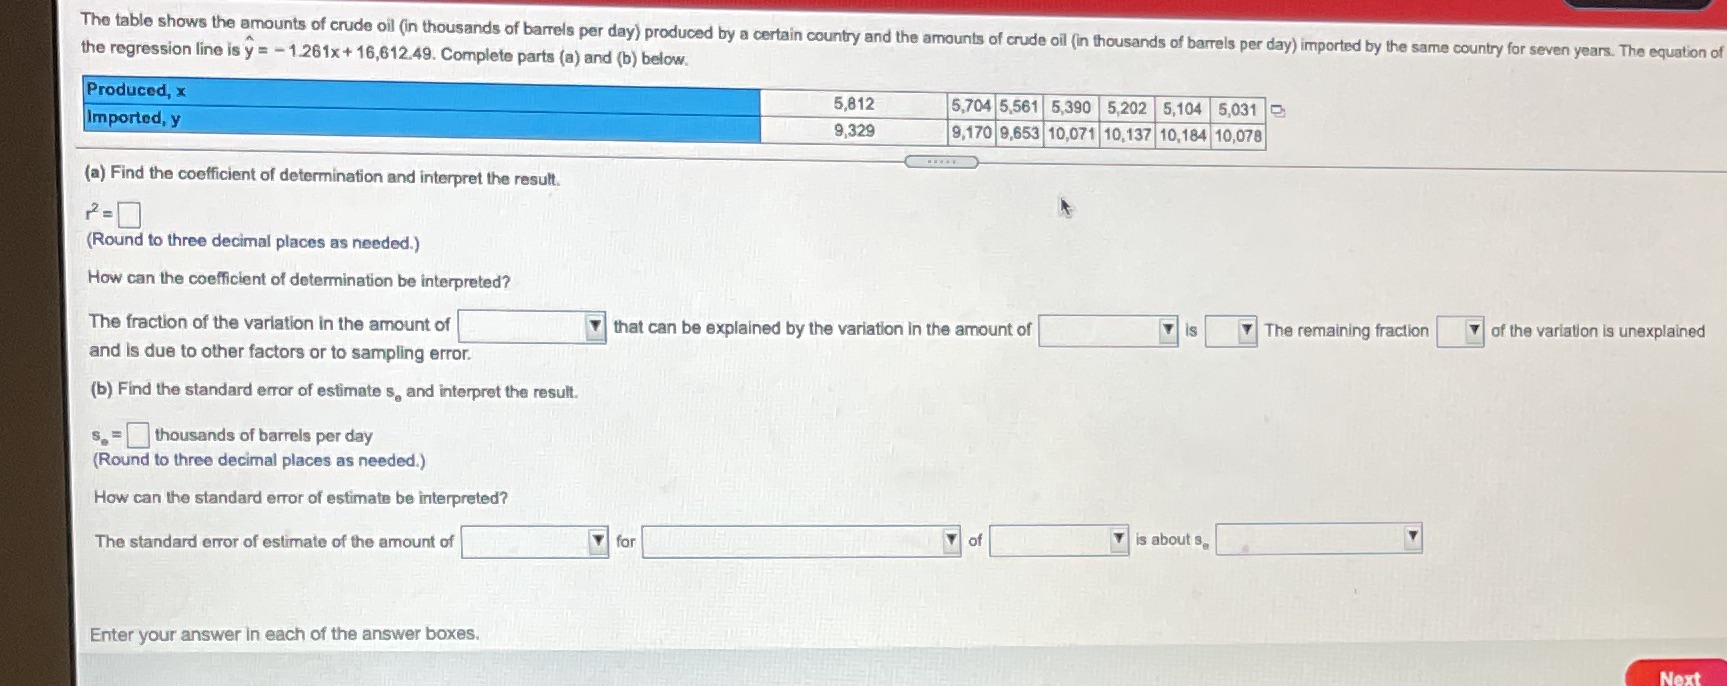
image text in transcribed
The table shows the amounts of crude oil (in thousands of barrels per day) produced by a certain country and the amounts of crude oil (in thousands of barrels per day) imported by the same country for seven years. The equation of the regression line is y = - 1.261x + 16,612.49. Complete parts (a) and (b) below. Produced, x 5,812 5,704 5,561 5,390 5,202 5,104 5,031 Imported, y 9,329 9,170 9,653 10,071 10,137 10,184 10,078 (a) Find the coefficient of determination and interpret the result. (Round to three decimal places as needed.) How can the coefficient of determination be interpreted? The fraction of the variation in the amount of that can be explained by the variation in the amount of The remaining fraction of the variation is unexplained and is due to other factors or to sampling error. (b) Find the standard error of estimate s. and interpret the result. s. = thousands of barrels per day (Round to three decimal places as needed.) How can the standard error of estimate be interpreted? The standard error of estimate of the amount of is about s. Enter your answer in each of the answer boxes. Next

Step by Step Solution

There are 3 Steps involved in it

Step: 1

blur-text-image

Get Instant Access to Expert-Tailored Solutions

See step-by-step solutions with expert insights and AI powered tools for academic success

Step: 2

blur-text-image

Step: 3

blur-text-image

Ace Your Homework with AI

Get the answers you need in no time with our AI-driven, step-by-step assistance

Get Started

Recommended Textbook for

Square Summable Power Series

Authors: Louis De Branges, James Rovnyak

1st Edition

ISBN: 0486801365, 9780486801360

More Books

Students also viewed these Mathematics questions