Answered step by step
Verified Expert Solution
Link Copied!

Question

1 Approved Answer

The table shows the emergency response time for ambulances in a town during May. Show the solution for mean, median, mode $Q 1, Q3, D
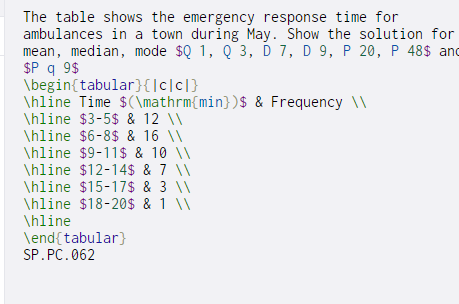
image text in transcribed

The table shows the emergency response time for ambulances in a town during May. Show the solution for mean, median, mode $Q 1, Q3, D 7, D 9, P 20, P 48$ and $P 99$ \begin{tabular}{[cc]} \hline Time $\mathrm{min})$ & Frequency \hline $3-5$ & 12 \hline $6-8$ & 16 \hline $9-11$ & 10 \hline $12-14$ & 7 \hline $15-17$ & 3 1 \hline $18-20$ & 1 W \hline \end{tabular) SP.PC.062

Step by Step Solution

There are 3 Steps involved in it

Step: 1

blur-text-image

Get Instant Access to Expert-Tailored Solutions

See step-by-step solutions with expert insights and AI powered tools for academic success

Step: 2

blur-text-image

Step: 3

blur-text-image

Ace Your Homework with AI

Get the answers you need in no time with our AI-driven, step-by-step assistance

Get Started

Recommended Textbook for

More Books

Students also viewed these Databases questions