Answered step by step
Verified Expert Solution
Link Copied!

Question

1 Approved Answer

The table shows the number of college students who prefer a given pizza topping toppings freshman sophomore junior senior cheese 13 15 23 21 meat
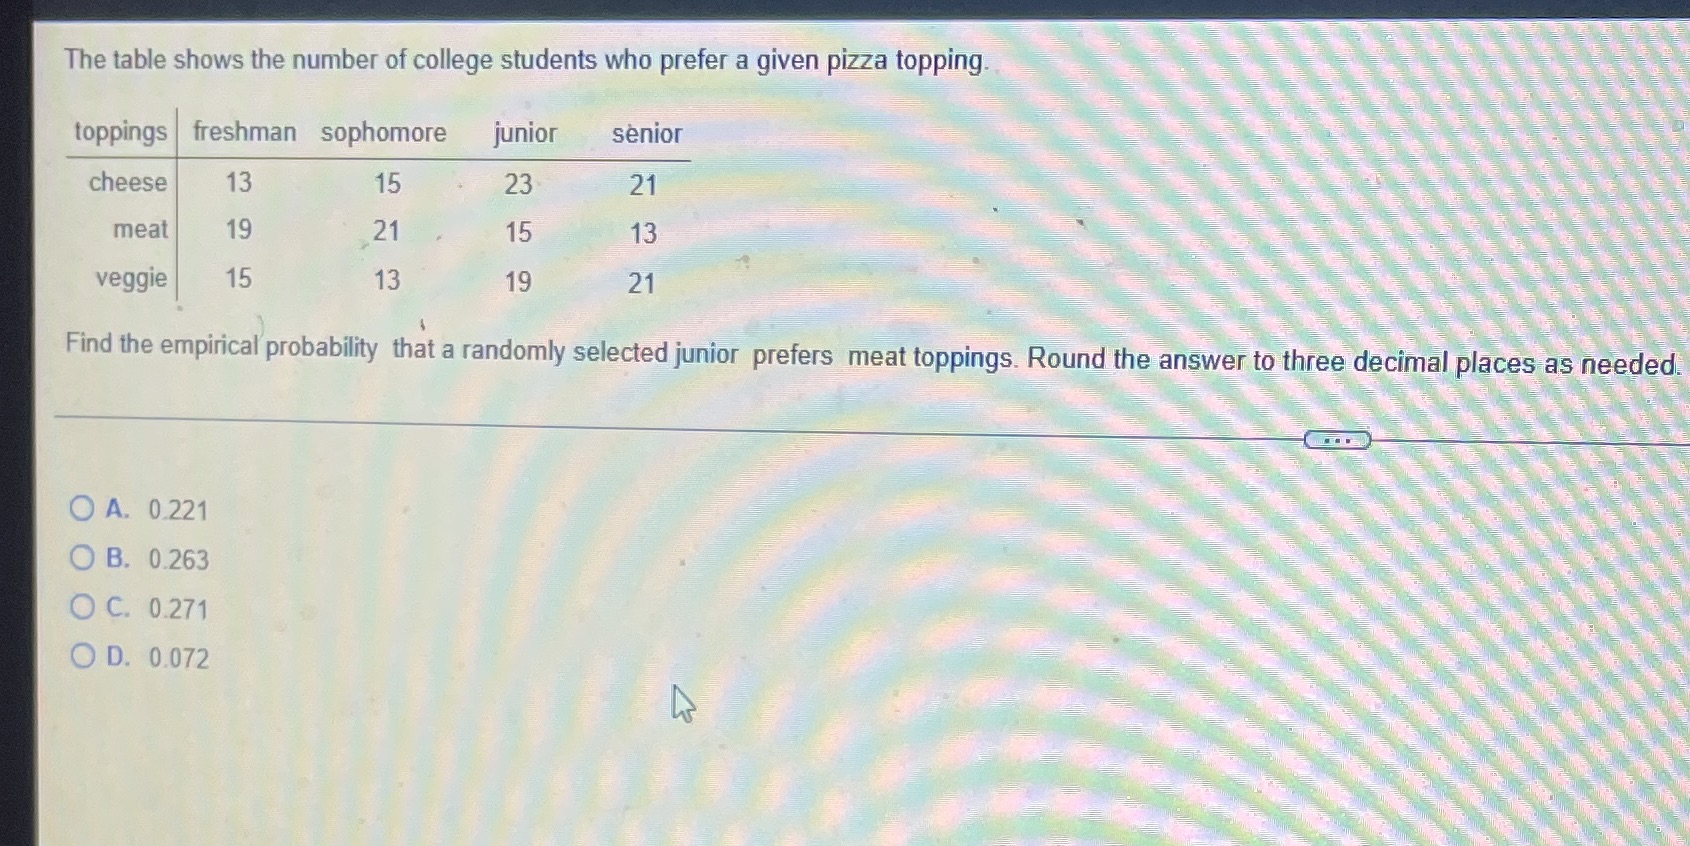
image text in transcribed
The table shows the number of college students who prefer a given pizza topping toppings freshman sophomore junior senior cheese 13 15 23 21 meat 19 21 15 13 veggie 15 13 19 21 Find the empirical probability that a randomly selected junior prefers meat toppings. Round the answer to three decimal places as needed. O A. 0.221 O B. 0.263 O C. 0.271 O D. 0.072

Step by Step Solution

There are 3 Steps involved in it

Step: 1

blur-text-image

Get Instant Access to Expert-Tailored Solutions

See step-by-step solutions with expert insights and AI powered tools for academic success

Step: 2

blur-text-image

Step: 3

blur-text-image

Ace Your Homework with AI

Get the answers you need in no time with our AI-driven, step-by-step assistance

Get Started

Recommended Textbook for

Linear Algebra With Applications

Authors: W. Keith Nicholson

7th Edition

978-0070985100, 70985103

More Books

Students also viewed these Mathematics questions