Answered step by step
Verified Expert Solution
Question
1 Approved Answer
The table to the right provides the number of mergers and acquisitions made during January 1 through January 11 of each year for an 8
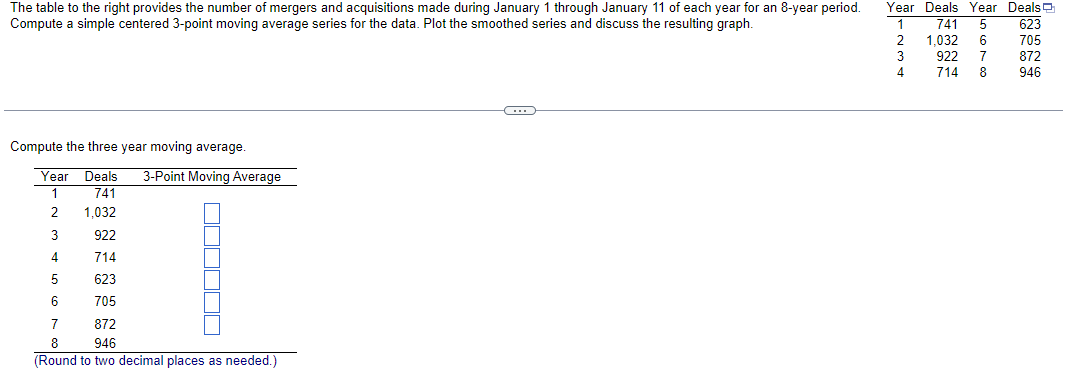
 The table to the right provides the number of mergers and acquisitions made during January 1 through January 11 of each year for an 8 -year period. Compute a simple centered 3-point moving average series for the data. Plot the smoothed series and discuss the resulting graph. Compute the three year moving average. (Kound to two decimal places as needed.)
 Step by Step Solution
There are 3 Steps involved in it
Step: 1

Get Instant Access to Expert-Tailored Solutions
See step-by-step solutions with expert insights and AI powered tools for academic success
Step: 2

Step: 3

Ace Your Homework with AI
Get the answers you need in no time with our AI-driven, step-by-step assistance
Get Started


