

Question
The table to the right shows teenage drug use in different countries Make a scatter plot for the given data Use the scatter plot to
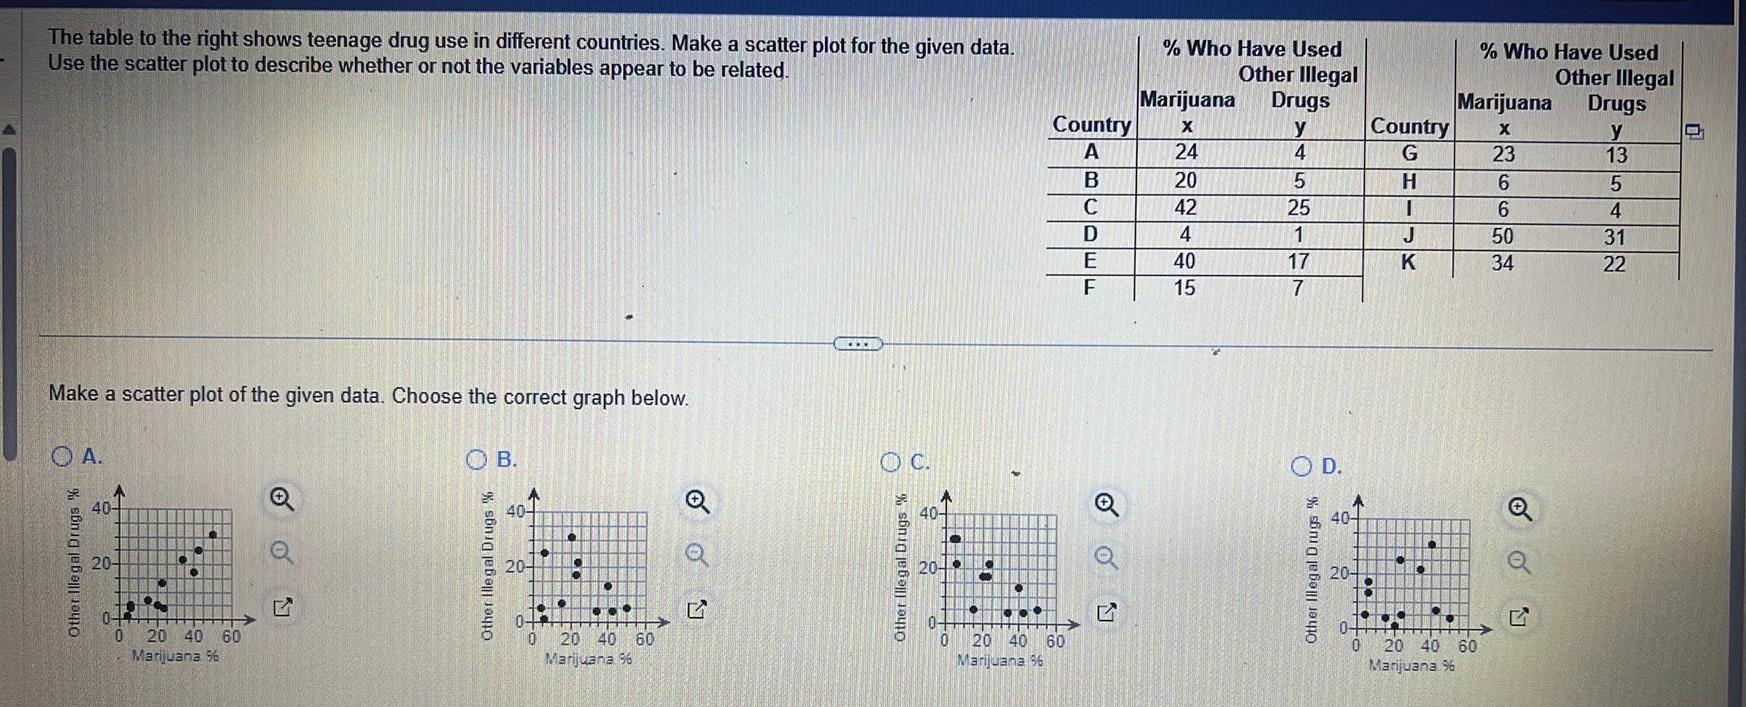

The table to the right shows teenage drug use in different countries Make a scatter plot for the given data Use the scatter plot to describe whether or not the variables appear to be related Make a scatter plot of the given data Choose the correct graph below O A 40 20 04 0 20 40 60 Marijuana 96 G OB 40 20 10 0 20 40 60 Marijuana Q Q OC 40 20 0 0 Country A B C D E F 20 40 60 Marijuana 96 Q Who Have Used Other Illegal Marijuana X 24 20 42 4 40 15 Drugs y 4 5 25 1 17 7 OD 40 20 0 Country G H 1 J K Who Have Used Other Illegal Drugs y 13 5 4 31 22 Marijuana X 23 6 6 50 34 0 20 40 60 Marijuana 96 Q
Step by Step Solution
There are 3 Steps involved in it
Step: 1

Get Instant Access to Expert-Tailored Solutions
See step-by-step solutions with expert insights and AI powered tools for academic success
Step: 2

Step: 3
Ace Your Homework with AI
Get the answers you need in no time with our AI-driven, step-by-step assistance
Get Started
Industrial Tomography Systems And Applications
Authors: Mi Wang
1st Edition
1782421238, 9781782421238