

Answered step by step
Verified Expert Solution
Question
1 Approved Answer
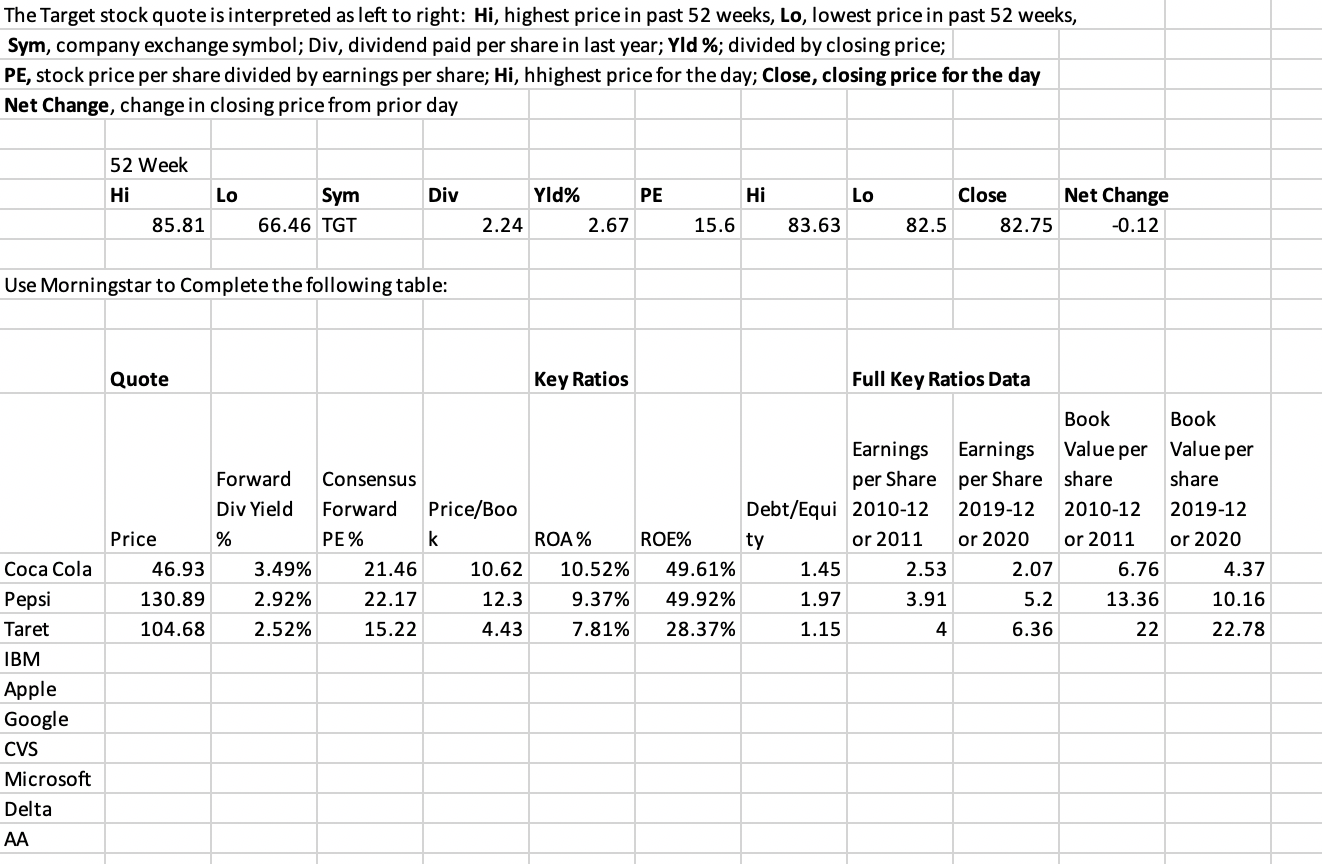
The Target stock quote is interpreted as left to right: Hi, highest price in past 52 weeks, Lo, lowest price in past 52 weeks, Sym,
Step by Step Solution
There are 3 Steps involved in it
Step: 1

Get Instant Access to Expert-Tailored Solutions
See step-by-step solutions with expert insights and AI powered tools for academic success
Step: 2

Step: 3
Ace Your Homework with AI
Get the answers you need in no time with our AI-driven, step-by-step assistance
Get Started
Advanced Financial Accounting
Authors: Theodore E. Christensen, David M. Cottrell, Richard E. Baker
10th edition
78025621, 978-0078025624