

Question
. The Tastee Bakery Company supplies a bakery product to many supermarkets in a metropolitan area. The company wishes to study the effect of the
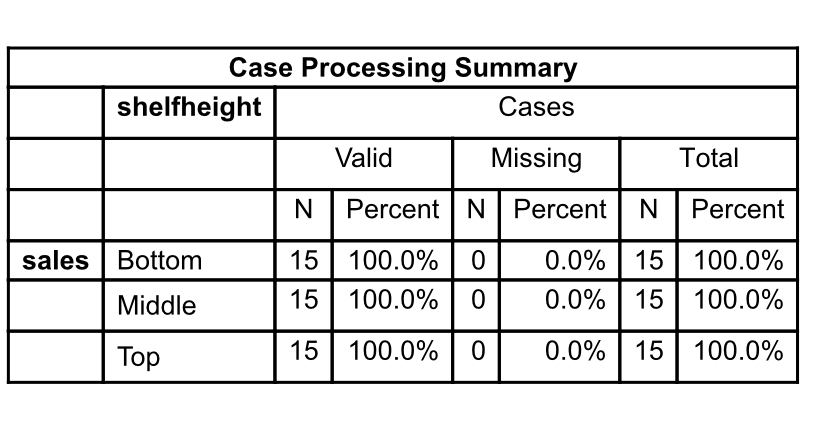
. The Tastee Bakery Company supplies a bakery product to many supermarkets in a metropolitan area. The company wishes to study the effect of the shelf display height employed by the supermarkets on monthly sales (measured in cases of 10 units each) for this product. Shelf display height, the factor to be studied, has three levels - bottom (B), middle (M), and top (T) - which are the treatments. To compare these treatments, the bakery uses a completely randomized experimental design. For each shelf height, fifteen supermarkets (the experimental units) of equal sales potential are randomly selected, and each supermarket displays the product using its assigned height for the month. At the end of the month, sales of the bakery product (the response variable) at the 45 participating stores are recorded. Here we assume that the set of sales amounts for each display height is a sample randomly selected from the population of all sales amounts that could be obtained (at supermarkets of the given sales potential) at that display height. SPSS output is given at the end of the question (beginning on the next page).
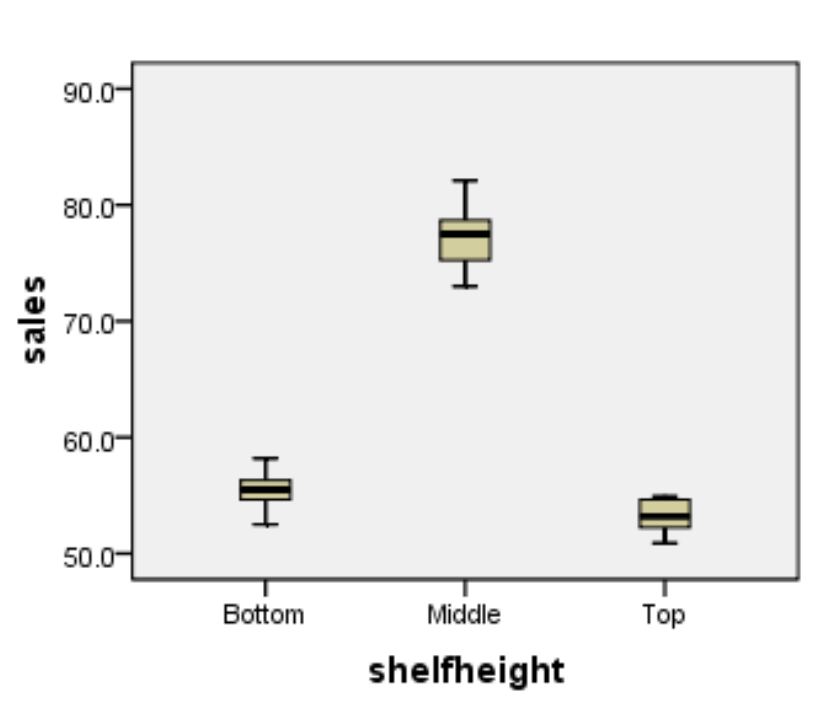
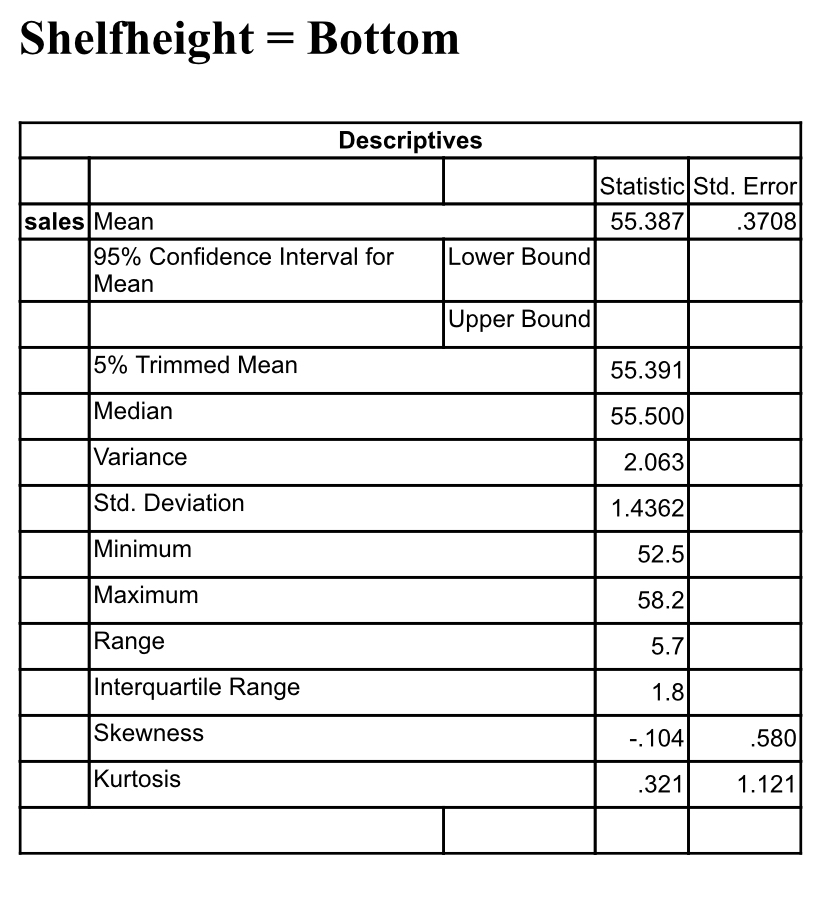
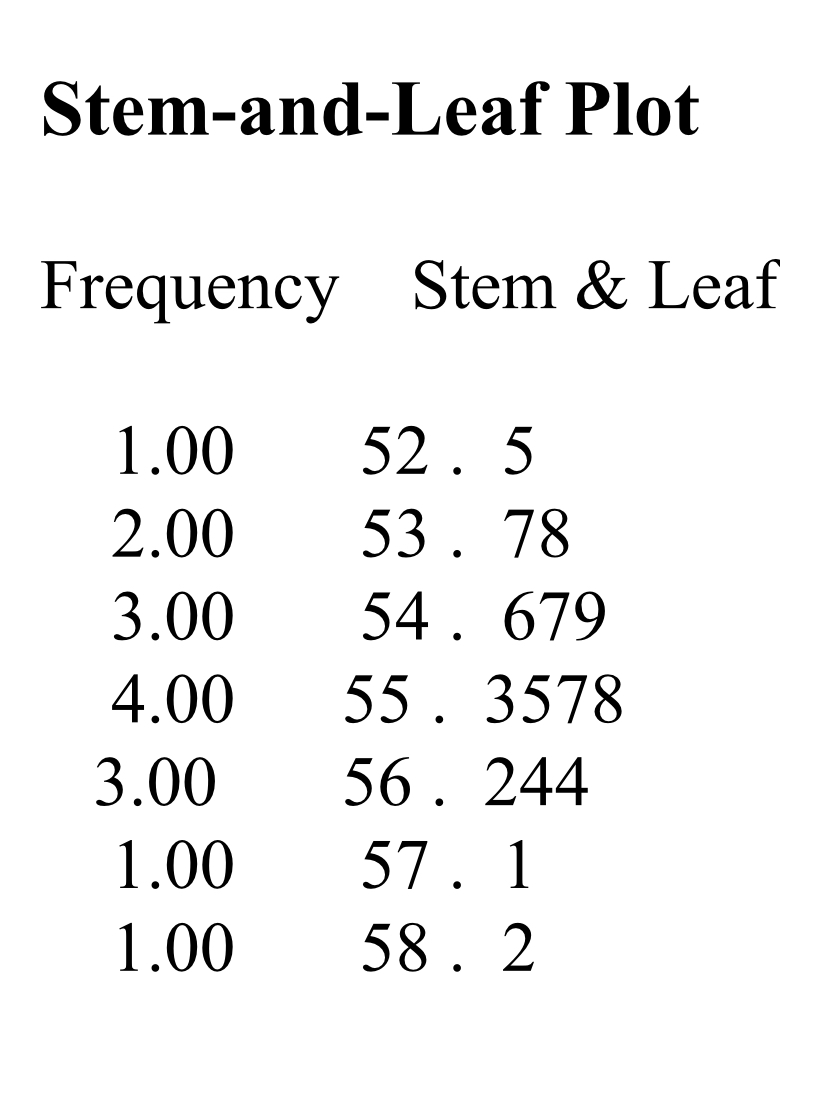
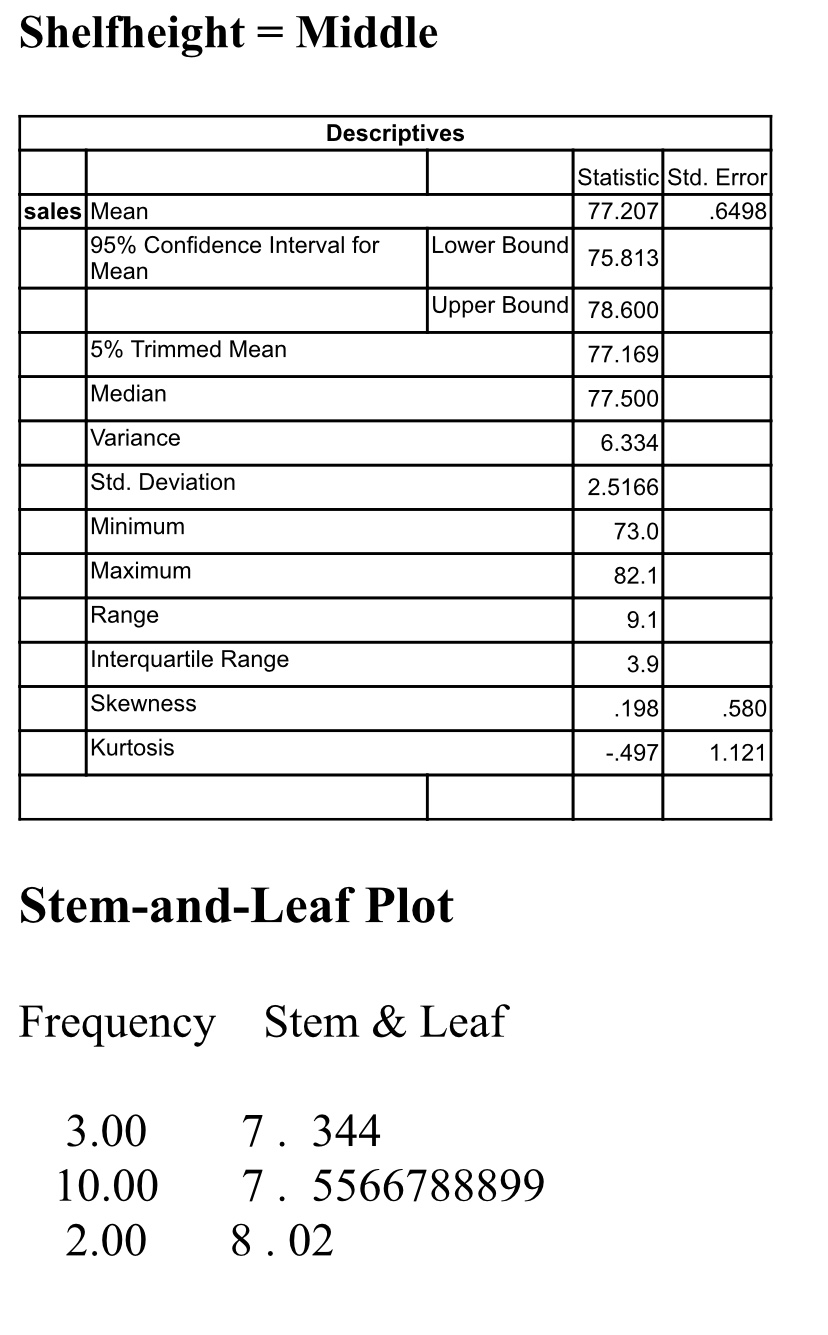
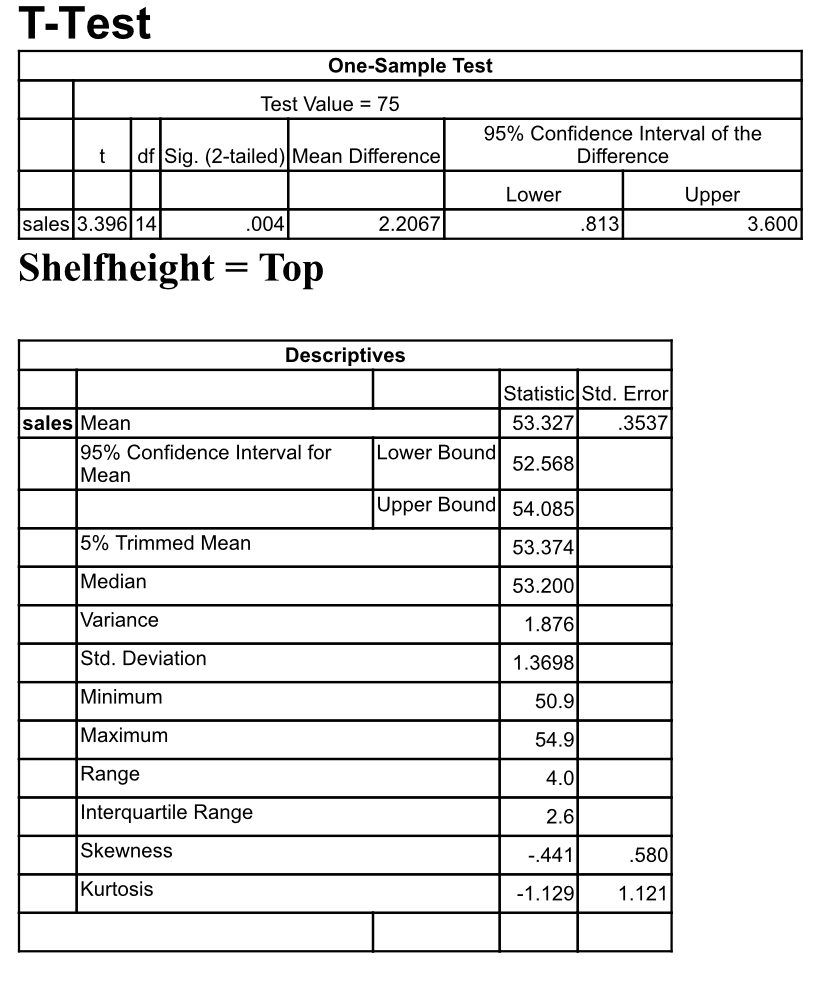
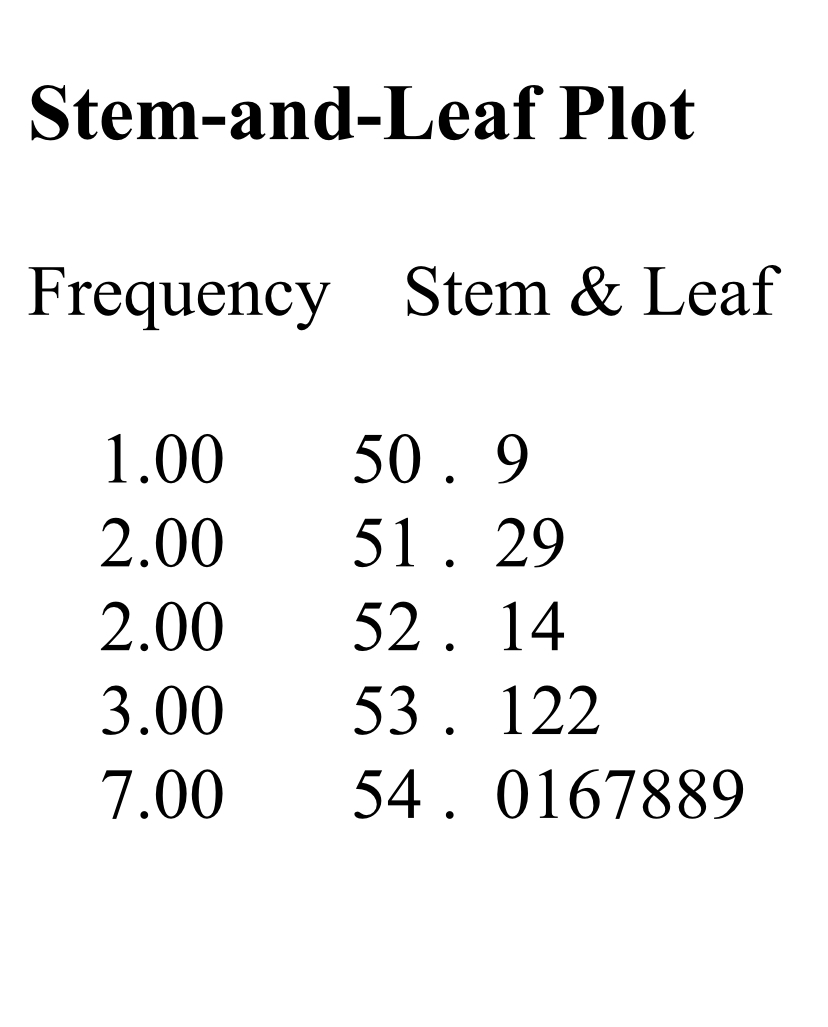
- What is the population mean monthly sales when the product is displayed at the bottom shelf height? At the middle shelf? At the top shelf? Respond with 95% confidence.
- Based on your results in part (a), is there a statistically significant difference among shelf display heights with respect to mean monthly sales? Defend your answer.
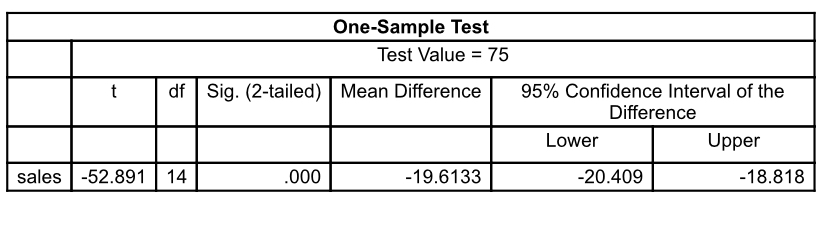
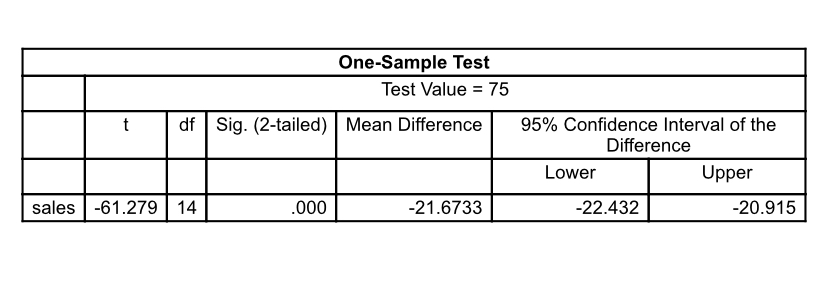
- A market researcher hypothesized that the population mean monthly sales for the product when displayed at the middle shelf height is greater than 75 cases. Is there clear evidence at the 5% significance level to support the market researcher's hypothesis? Defend your answer.
- Any concerns about the believability or efficiency of your results in part (c)? Defend your answer
Step by Step Solution
There are 3 Steps involved in it
Step: 1

Get Instant Access to Expert-Tailored Solutions
See step-by-step solutions with expert insights and AI powered tools for academic success
Step: 2

Step: 3
Ace Your Homework with AI
Get the answers you need in no time with our AI-driven, step-by-step assistance
Get Started
Mathematical Applications For The Management, Life And Social Sciences
Authors: Ronald J. Harshbarger, James J. Reynolds
12th Edition
978-1337625340