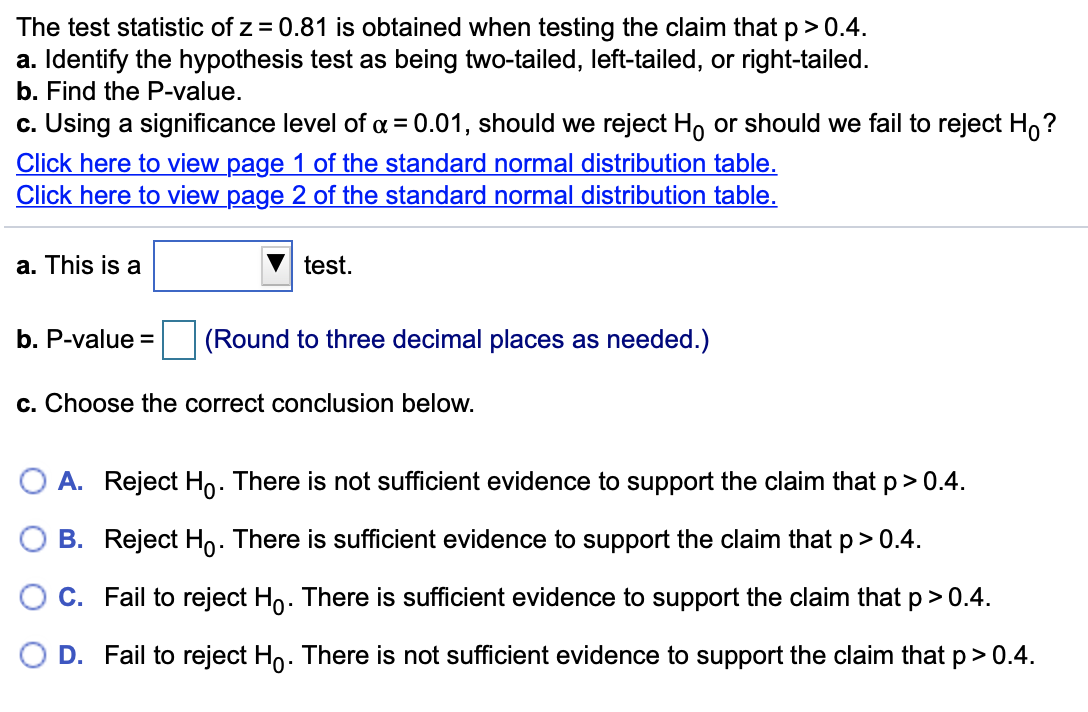
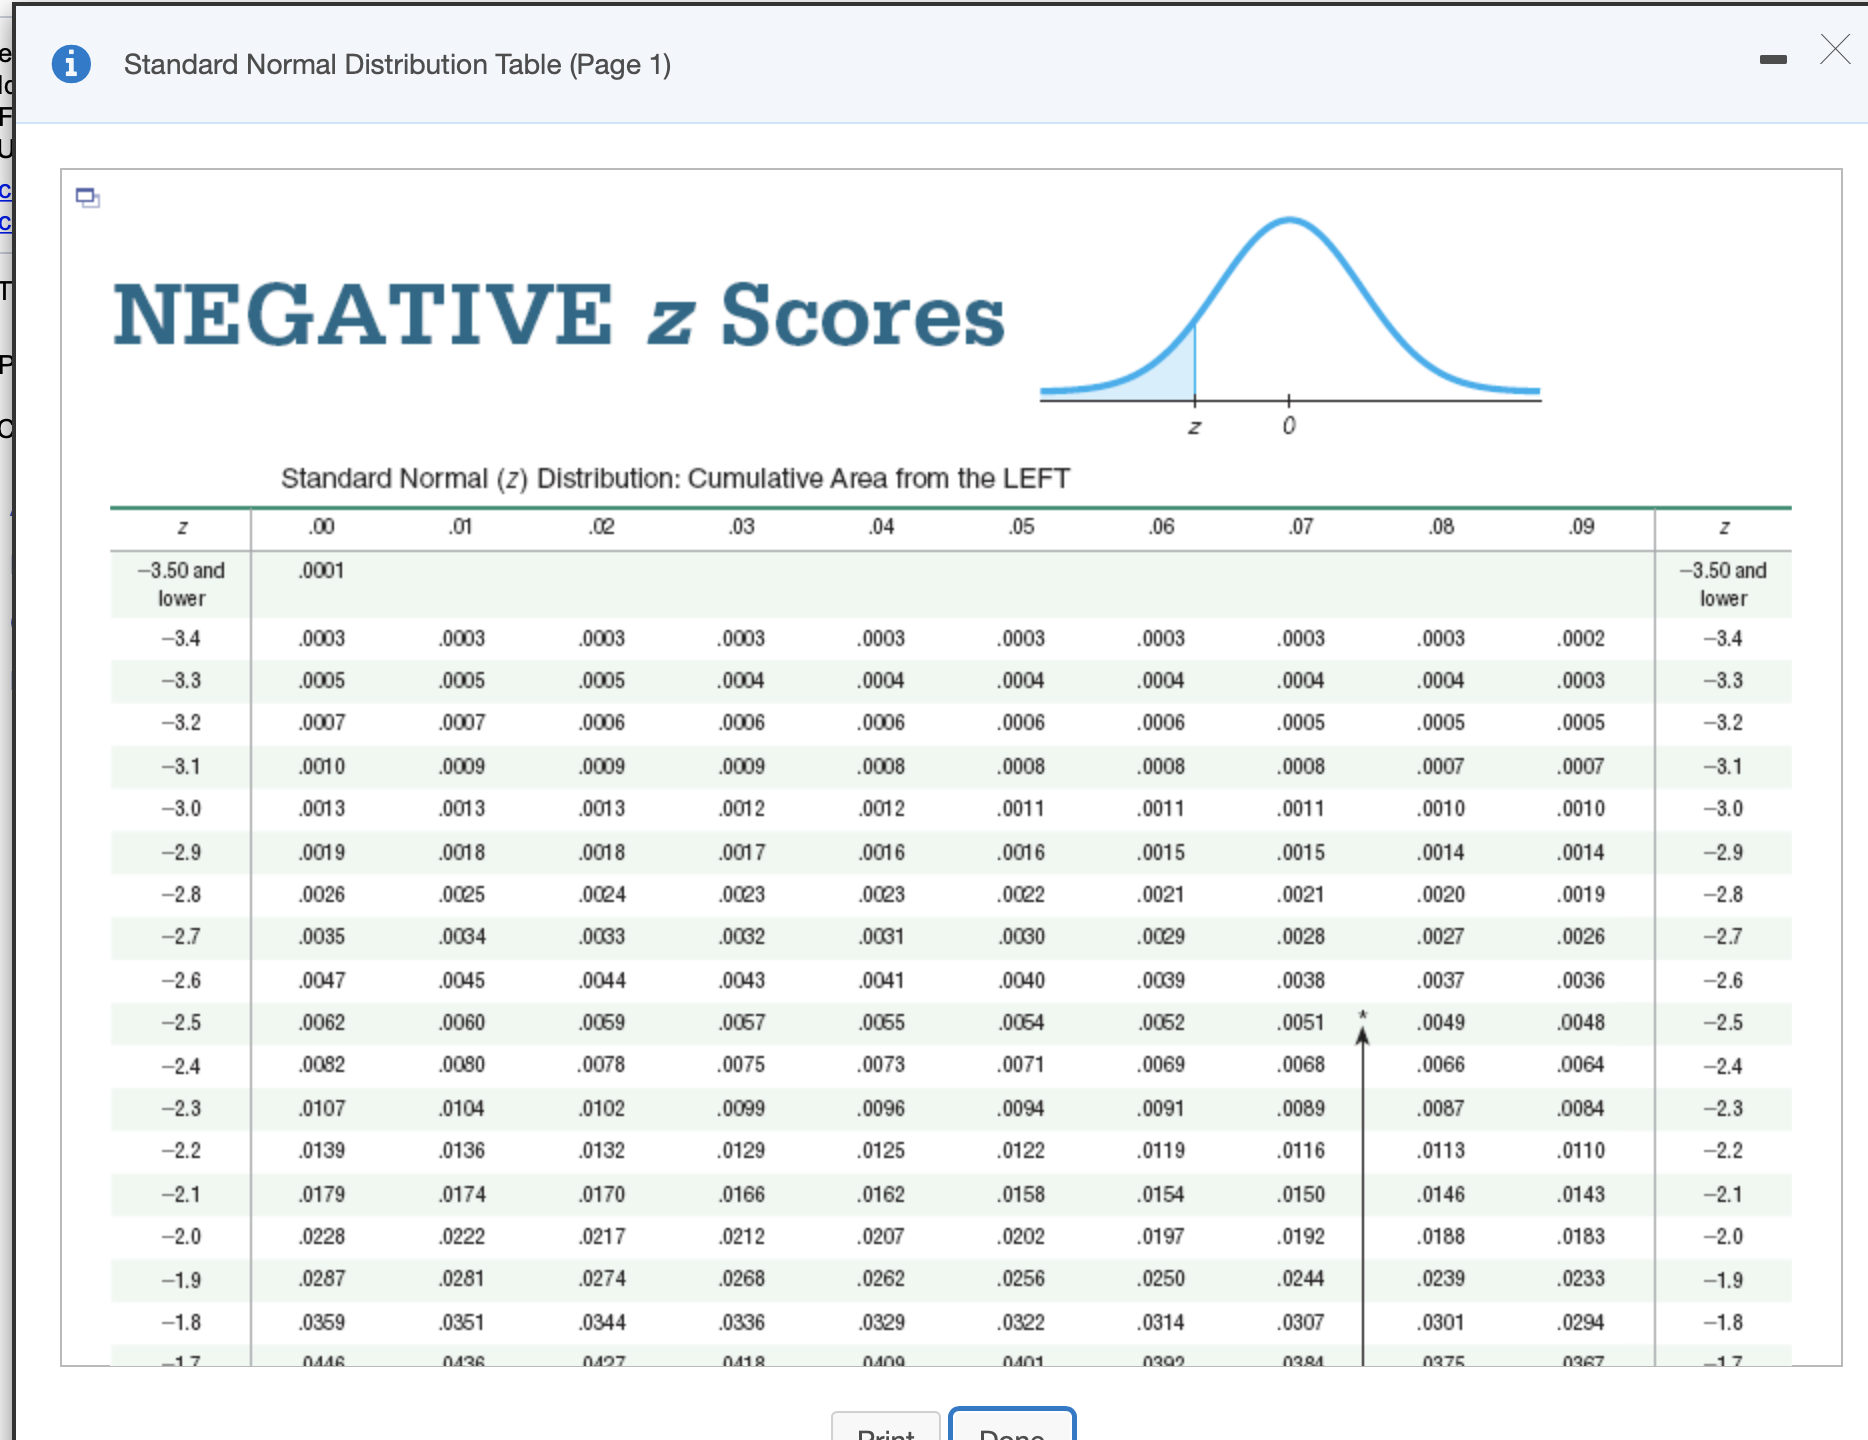
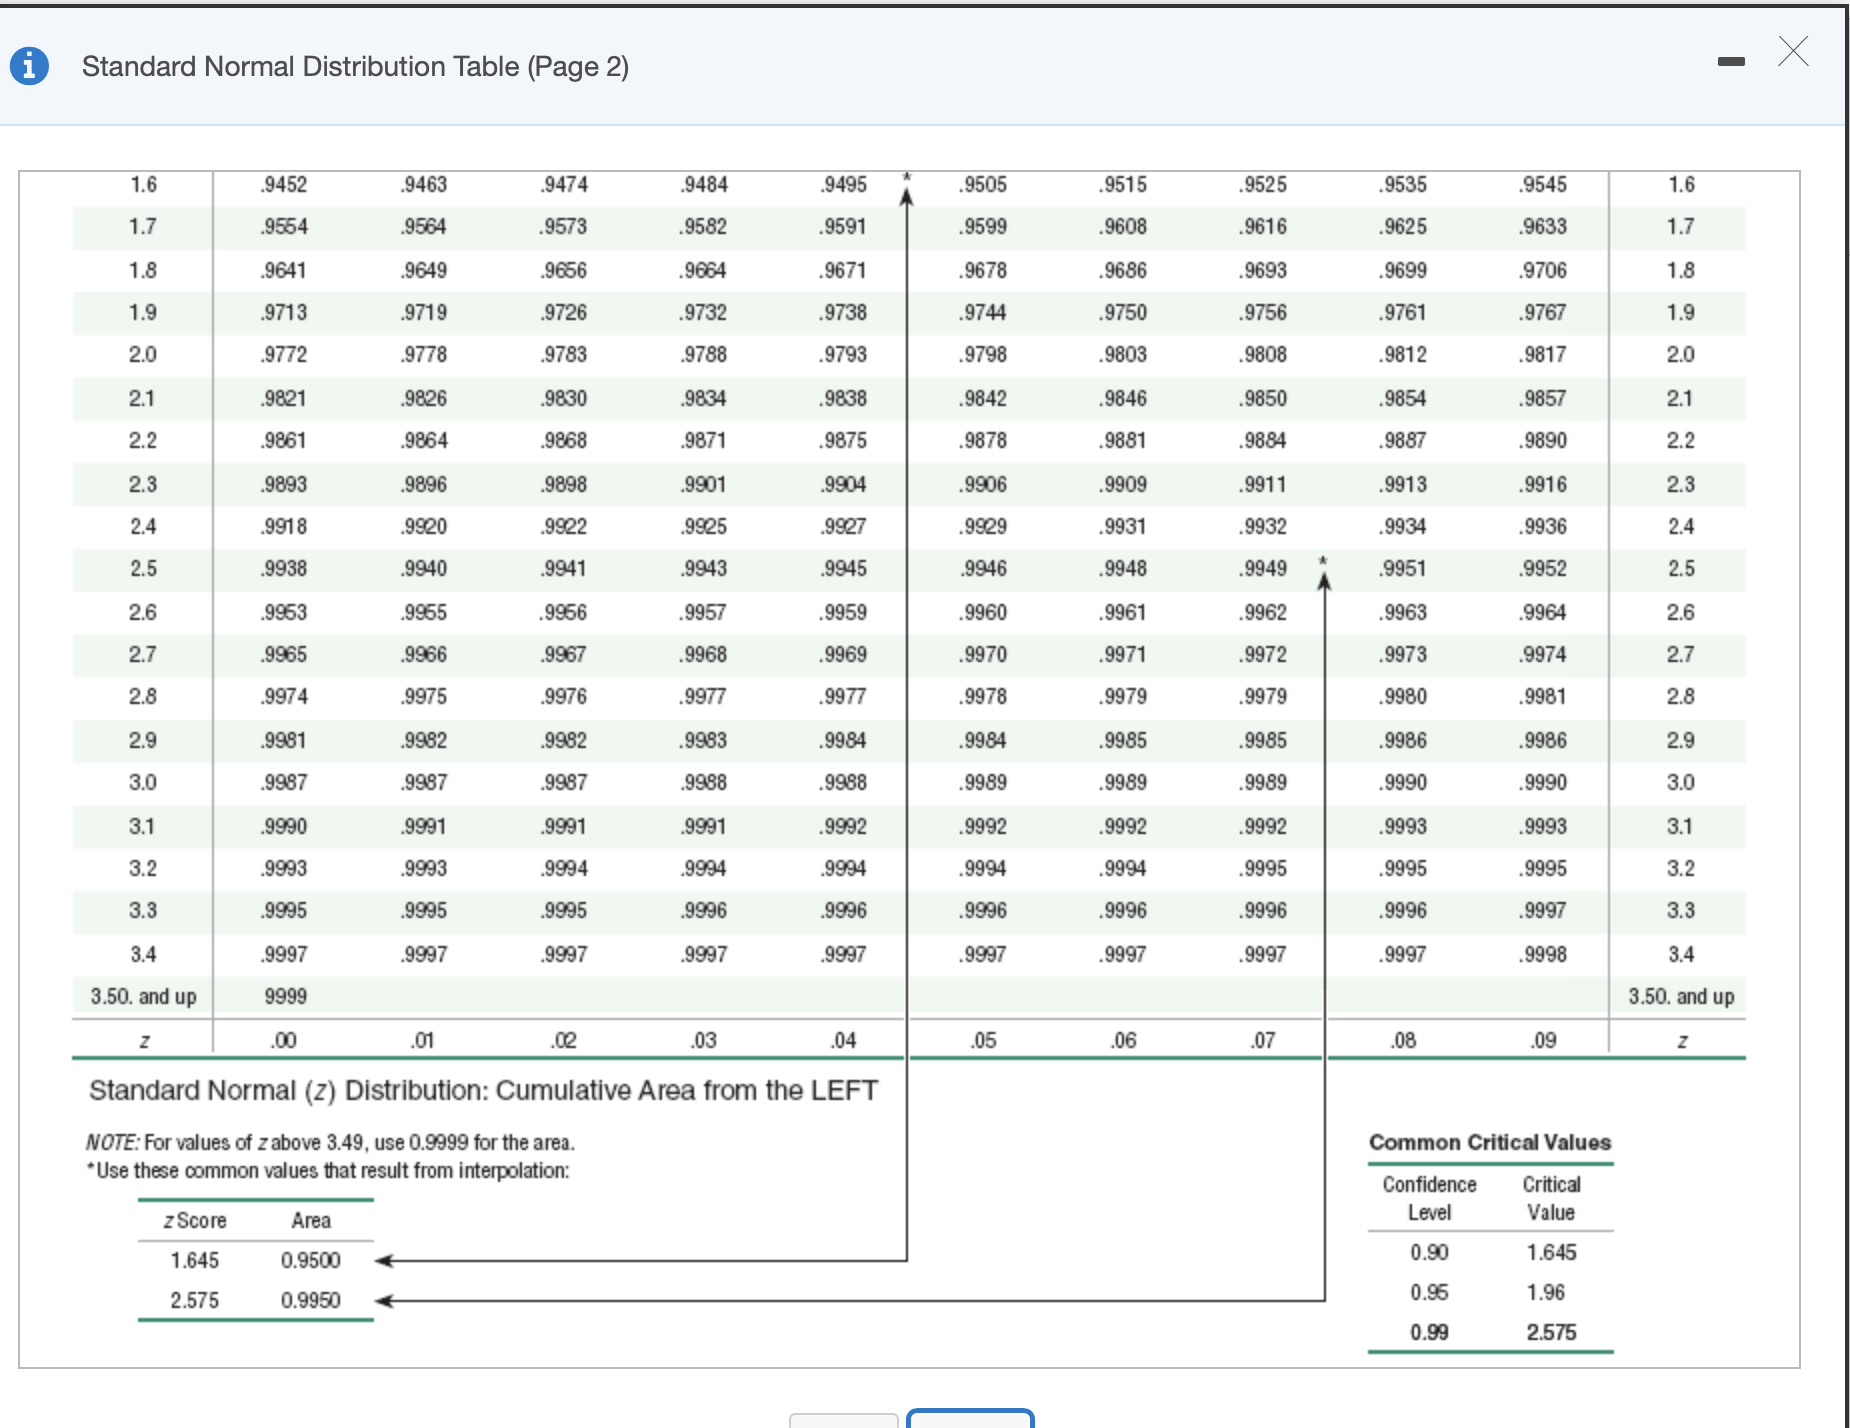
The test statistic of z = 0.81 is obtained when testing the claim that p > 0.4. a. Identify the hypothesis test as being two-tailed, left-tailed, or right-tailed. b. Find the P-value. c. Using a significance level of a = 0.01, should we reject Ho or should we fail to reject Ho? Click here to view page 1 of the standard normal distribution table. Click here to view page 2 of the standard normal distribution table. a. This is a test. b. P-value = (Round to three decimal places as needed.) c. Choose the correct conclusion below. O A. Reject Ho. There is not sufficient evidence to support the claim that p > 0.4. O B. Reject Ho. There is sufficient evidence to support the claim that p > 0.4. O C. Fail to reject Ho. There is sufficient evidence to support the claim that p > 0.4. O D. Fail to reject Ho. There is not sufficient evidence to support the claim that p > 0.4.- X i Standard Normal Distribution Table (Page 1) NEGATIVE z Scores Standard Normal (z) Distribution: Cumulative Area from the LEFT .06 .07 .08 09 Z Z .00 .01 .02 .03 .04 .05 -3.50 and -3.50 and 0001 ower lower . 0003 0003 0003 0003 0002 -3.4 -3.4 .0003 .0003 0003 .0003 .0003 0004 0004 0003 -3.3 -3.3 0005 0005 0005 0004 0004 0004 .0004 -3.2 0007 .0007 0006 0006 .0006 0006 0006 0005 .0005 0005 -3.2 0008 0007 .0007 -3.1 -3.1 .0010 .0009 0009 0009 .0008 .0008 0008 .0013 .0012 .0012 .0011 0011 .0011 .0010 .0010 -3.0 -3.0 .0013 .0013 . 0015 0014 .0014 -2.9 -2.9 0019 .0018 .0018 .0017 .0016 0016 0015 0019 -2.8 -2.8 0026 0025 0024 0023 0023 .0022 0021 .0021 0020 -2.7 0035 .0034 .0033 0032 .0031 .0030 .0029 .0028 .0027 0026 -2.7 0037 0036 -2.6 -2.6 0047 0045 0044 0043 .0041 0040 0039 .0038 -2.5 -2.5 0062 .0060 0059 0067 .0065 0054 .0062 0051 . 0049 .0048 0082 .0080 .0078 .0075 .0073 .0071 .0069 0068 0066 .0064 -2.4 -2.4 .0104 .0102 0099 .0096 0094 . 0091 .0089 . 0087 .0084 -2.3 -2.3 .0107 .0110 -2.2 -2.2 0139 .0136 .0132 .0129 .0125 0122 0119 .0116 0113 0174 .0170 0166 .0162 0158 0154 .0150 0146 .0143 -2.1 -2.1 0179 0197 .0192 0188 .0183 -2.0 -2.0 .0228 .0222 .0217 .0212 .0207 .0202 .0233 -1.9 -1.9 0287 .0281 .0274 .0268 0262 0256 0250 0244 0239 -1.8 0359 .0351 0344 .0336 0329 0322 .0314 0307 .0301 .0294 -1.8 17 -17 DAAR 0426 0427 0418 nana 0376- X i Standard Normal Distribution Table (Page 2) .9515 9525 9535 9545 1.6 1.6 .9452 .9463 .9474 .9484 .9495 9505 .9564 9564 9573 .9582 9591 9599 9608 .9616 9625 9633 1.7 1.7 1.8 1.8 9641 9649 9656 9664 .9671 9678 9686 9693 9699 9706 .9732 .9738 .974 9750 .9756 9761 9767 1.9 1.9 9713 .9719 .9726 .9812 9817 2.0 2.0 .9772 .9778 .9783 .9788 .9793 9798 .9803 .9808 2.1 2.1 9821 .9826 .9830 .9834 .9838 .9842 .9846 9850 .9854 9857 .9864 9868 .9871 .9875 .9878 .9881 9884 .9887 9890 2.2 2.2 9861 9904 .9906 9909 9911 .9913 9916 2.3 2.3 9893 .9896 9898 .9901 9934 9936 2.4 2.4 .9918 .9920 9922 9925 .9927 .9929 9931 .9932 2.5 2.5 .9938 .9940 9941 1943 9945 9946 9948 9949 .9951 9952 2.6 2.6 9953 9955 9956 9957 9959 9960 9961 .9962 9963 9964 9965 .9966 .9967 9968 .9969 .9970 .9971 .9972 .9973 .9974 2.7 2.7 .9980 9981 2.8 2.8 .9974 .9975 .9976 .9977 .9977 .9978 9979 .9979 9986 9986 2.9 2.9 9981 .9982 .9982 1983 .9984 .9984 9985 .9985 9990 9990 3.0 3.0 9987 .9987 9987 1988 .9988 .9989 9989 9989 .9991 . 9992 . 9992 9992 .9992 .9993 9993 3.1 3.1 9990 .9991 .9991 . 9995 .9995 9995 3.2 3.2 .9993 .9993 .9994 1994 .9994 9994 9994 9995 9995 .9996 9996 9996 9996 9996 9997 3.3 3.3 9995 9996 9998 34 3.4 9997 9997 9997 .9997 9997 9997 9997 9997 9997 3.50. and up 3.50. and up 9999 .02 03 .04 05 06 .07 08 09 .00 01 Standard Normal (z) Distribution: Cumulative Area from the LEFT Common Critical Values NOTE: For values of z above 3.49, use 0.9999 for the area. *Use these common values that result from interpolation: Confidence Critical Level Value z Score Area 0.90 1.645 1.645 0.9500 0.95 1.96 2.575 0.9950 0.99 2.575


