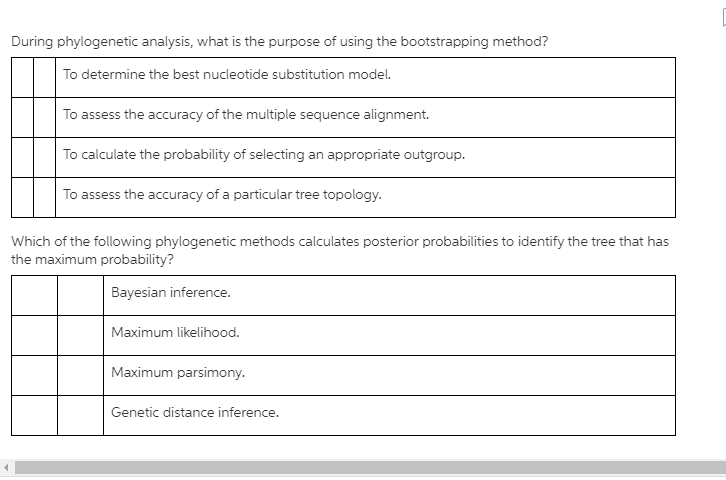
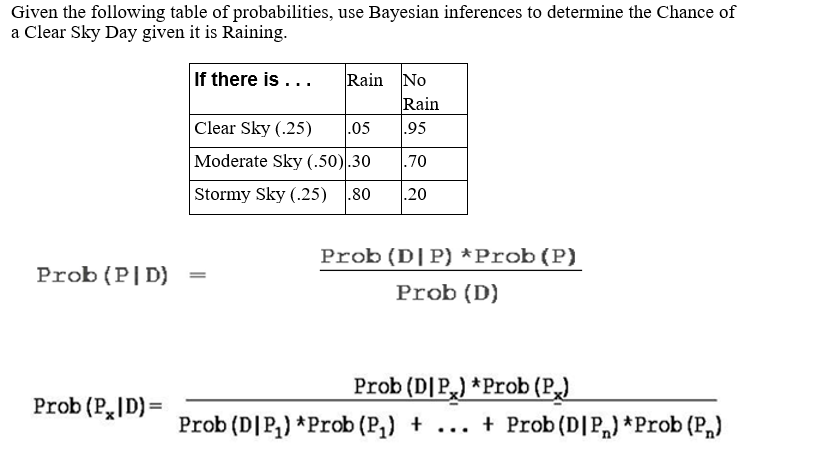
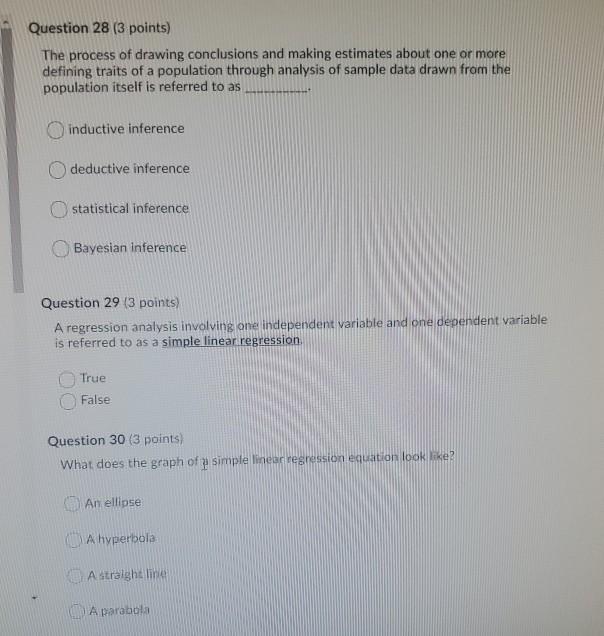
The thicknesses of two different layers of ink are considered random variables jointly distributed by the bivariate normal.
It is known that the first layer has a mean of 0.1 millimeters and a standard deviation of 3.1 millimeters, and the second layer has a mean of 0.23 millimeters and a standard deviation of 1.7 millimeters. Also, the correlation among the layers is 0.8. Moreover, specifications call for a product to have a thickness of the first layer in the range of 0.099 to 0.200 millimeters and for the second layer in the range of 0.230 to 0.250 millimeters (mm). Define random variables in your notes.
What is the variance of the sum of the two layers' thicknesses?
What is the covariance between layers?
An article in the Journal of the American Statistical Association "Illustration of Bayesian Inference in Normal Data Models Using Gibbs Sampling" (1990, Vol. 85, pp. 972-985)] measured the weight of 30 rats under experiment controls. Suppose that 12 were underweight rats. Using the point estimate of p obtained from the preliminary sample, what sample size is needed to be 95% confident that the error in estimating the true value of p is less than 0.02?During phylogenetic analysis, what is the purpose of using the bootstrapping method? I. To determine the best nucleotide substitution modeL II To assess the accuracy of the multiple sequence alignmerrt. II To calculate the probability of selecting an appropriate outgroup. II To assess the accuracy of a particular tree topology. 1I.I'|.lhich of the following phylogenetic methods calculates posterior probabilities to identify the tree that has the maximum probability? I. .. Maximum likelihood. I. .. Genetic distance irrference. Given the following table of probabilities, use Bayesian inferences to determine the Chance of a Clear Sky Day given it is Raining If there is . . . Rain No Rain Clear Sky (.25) 05 95 Moderate Sky (.50) .30 70 Stormy Sky (.25) 1.80 20 Prob (D| P) *Prob (P) Prob ( P| D) = Prob (D) Prob (D| P,) *Prob (P,) Prob (P, [ D) = Prob (D| P) *Prob (P]) + ... + Prob (D|P,) *Prob (P.)Question 28 (3 points) The process of drawing conclusions and making estimates about one or more defining traits of a population through analysis of sample data drawn from the population itself is referred to as Oinductive inference deductive inference statistical inference Bayesian inference Question 29 (3 points) A regression analysis involving one independent variable and one dependent variable is referred to as a simple linear regression True False Question 30 (3 points) What does the graph of a simple linear regression equation look like? An ellipse A hyperbola A straight ling A parabola