

Answered step by step
Verified Expert Solution
Question
1 Approved Answer
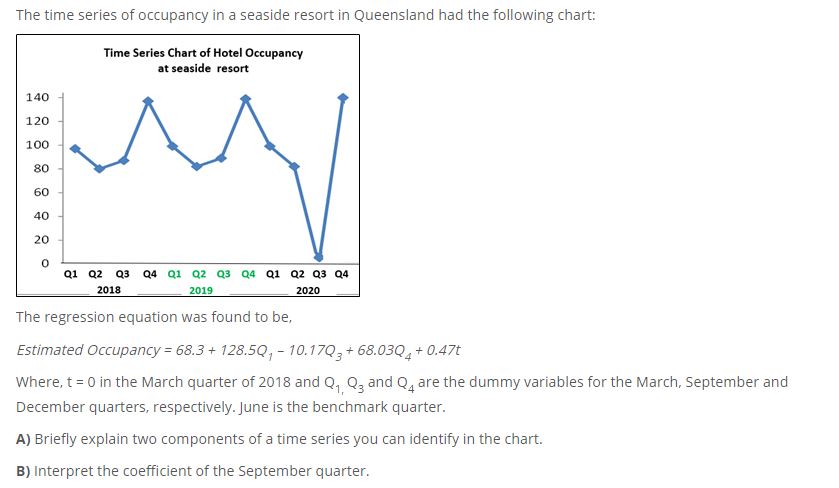
The time series of occupancy in a seaside resort in Queensland had the following chart: Time Series Chart of Hotel Occupancy at seaside resort 140
Step by Step Solution
There are 3 Steps involved in it
Step: 1

Get Instant Access to Expert-Tailored Solutions
See step-by-step solutions with expert insights and AI powered tools for academic success
Step: 2

Step: 3
Ace Your Homework with AI
Get the answers you need in no time with our AI-driven, step-by-step assistance
Get Started
Survey of Accounting
Authors: Thomas P. Edmonds, Frances M. McNair, Philip R. Olds, Bor Yi
3rd Edition
978-1259683794, 77490835, 1259683796, 9780077490836, 978-0078110856