Answered step by step
Verified Expert Solution
Question
1 Approved Answer
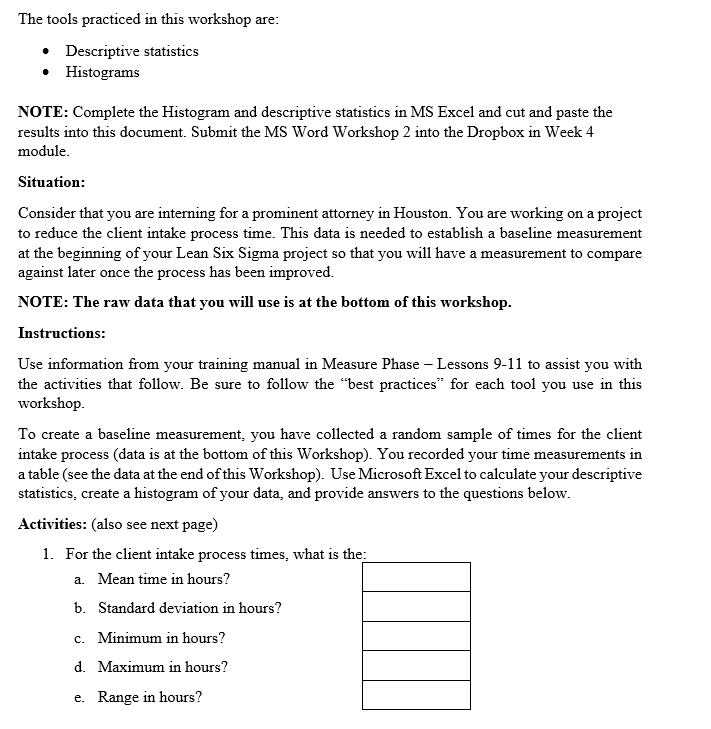
The tools practiced in this workshop are: Descriptive statistics Histograms NOTE: Complete the Histogram and descriptive statistics in MS Excel and cut and paste


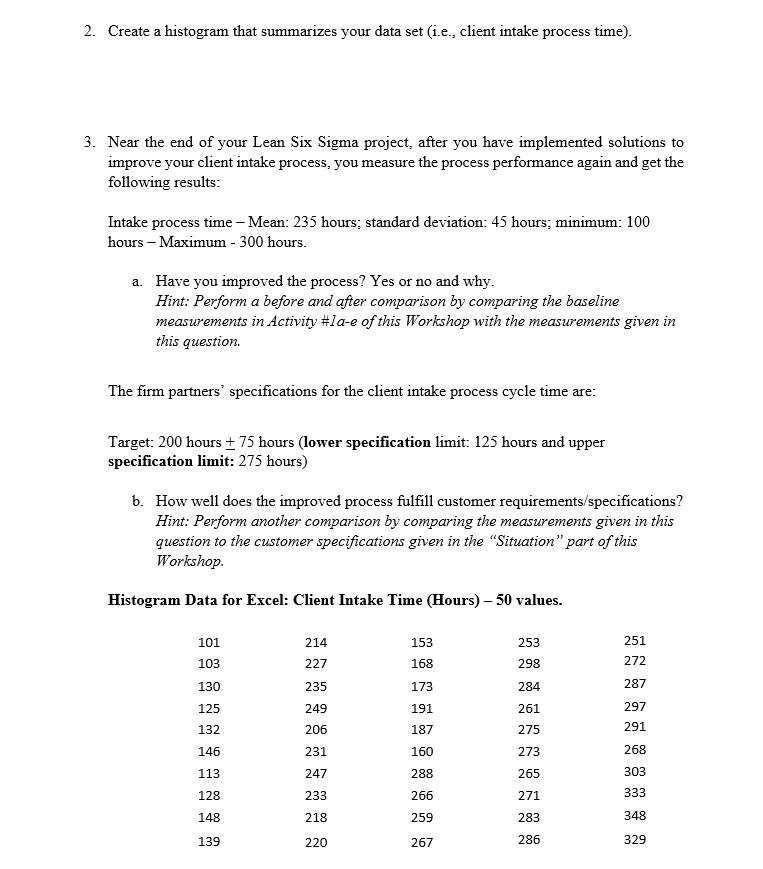
The tools practiced in this workshop are: Descriptive statistics Histograms NOTE: Complete the Histogram and descriptive statistics in MS Excel and cut and paste the results into this document. Submit the MS Word Workshop 2 into the Dropbox in Week 4 module. Situation: Consider that you are interning for a prominent attorney in Houston. You are working on a project to reduce the client intake process time. This data is needed to establish a baseline measurement at the beginning of your Lean Six Sigma project so that you will have a measurement to compare against later once the process has been improved. NOTE: The raw data that you will use is at the bottom of this workshop. Instructions: Use information from your training manual in Measure Phase - Lessons 9-11 to assist you with the activities that follow. Be sure to follow the "best practices for each tool you use in this workshop. To create a baseline measurement, you have collected a random sample of times for the client intake process (data is at the bottom of this Workshop). You recorded your time measurements in a table (see the data at the end of this Workshop). Use Microsoft Excel to calculate your descriptive statistics, create a histogram of your data, and provide answers to the questions below. Activities: (also see next page) 1. For the client intake process times, what is the a. Mean time in hours? b. Standard deviation in hours? c. Minimum in hours? d. Maximum in hours? e. Range in hours? 2. Create a histogram that summarizes your data set (i.e., client intake process time). 3. Near the end of your Lean Six Sigma project, after you have implemented solutions to improve your client intake process, you measure the process performance again and get the following results: Intake process time - Mean: 235 hours; standard deviation: 45 hours; minimum: 100 hours - Maximum - 300 hours. a. Have you improved the process? Yes or no and why. Hint: Perform a before and after comparison by comparing the baseline measurements in Activity #la-e of this Workshop with the measurements given in this question. The firm partners' specifications for the client intake process cycle time are: Target: 200 hours + 75 hours (lower specification limit: 125 hours and upper specification limit: 275 hours) b. How well does the improved process fulfill customer requirements/specifications? Hint: Perform another comparison by comparing the measurements given in this question to the customer specifications given in the "Situation" part of this Workshop. Histogram Data for Excel: Client Intake Time (Hours) - 50 values. 101 103 130 125 132 146 113 128 148 139 214 227 235 249 206 231 247 233 218 220 153 168 173 191 187 160 288 266 259 267 253 298 284 261 275 273 265 271 283 286 251 272 287 297 291 268 303 333 348 329
Step by Step Solution
★★★★★
3.38 Rating (148 Votes )
There are 3 Steps involved in it
Step: 1

Get Instant Access to Expert-Tailored Solutions
See step-by-step solutions with expert insights and AI powered tools for academic success
Step: 2

Step: 3

Ace Your Homework with AI
Get the answers you need in no time with our AI-driven, step-by-step assistance
Get Started


