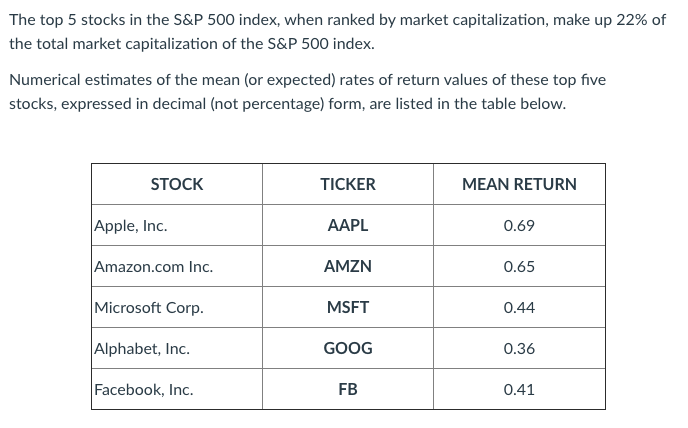
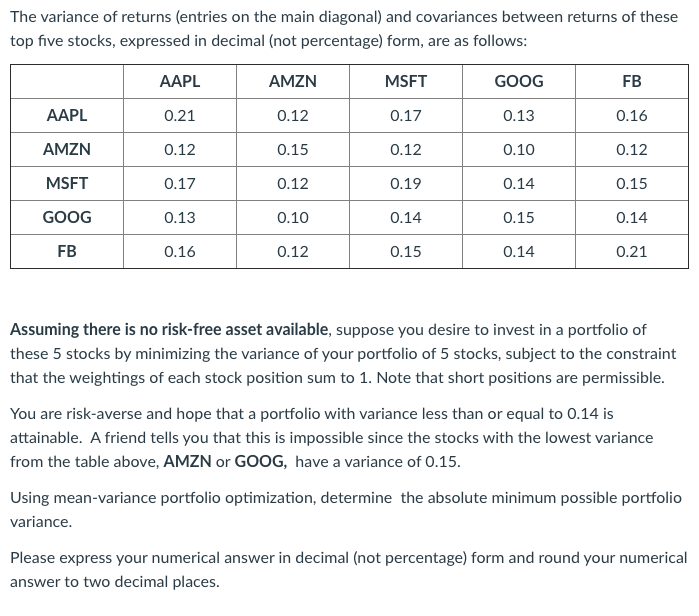
The top 5 stocks in the S&P 500 index, when ranked by market capitalization, make up 22% of the total market capitalization of the S&P 500 index. Numerical estimates of the mean (or expected) rates of return values of these top five stocks, expressed in decimal (not percentage) form, are listed in the table below. STOCK TICKER MEAN RETURN Apple, Inc. AAPL 0.69 Amazon.com Inc. AMZN 0.65 Microsoft Corp. MSFT 0.44 Alphabet, Inc. GOOG 0.36 Facebook, Inc. FB 0.41 The variance of returns (entries on the main diagonal) and covariances between returns of these top five stocks, expressed in decimal (not percentage) form, are as follows: AAPL AMZN MSFT GOOG FB AAPL 0.21 0.12 0.17 0.13 0.16 AMZN 0.12 0.15 0.12 0.10 0.12 MSFT 0.17 0.12 0.19 0.14 0.15 GOOG 0.13 0.10 0.14 0.15 0.14 FB 0.16 0.12 0.15 0.14 0.21 Assuming there is no risk-free asset available, suppose you desire to invest in a portfolio of these 5 stocks by minimizing the variance of your portfolio of 5 stocks, subject to the constraint that the weightings of each stock position sum to 1. Note that short positions are permissible. You are risk-averse and hope that a portfolio with variance less than or equal to 0.14 is attainable. A friend tells you that this is impossible since the stocks with the lowest variance from the table above, AMZN or GOOG, have a variance of 0.15. Using mean-variance portfolio optimization, determine the absolute minimum possible portfolio variance. Please express your numerical answer in decimal (not percentage) form and round your numerical answer to two decimal places. The top 5 stocks in the S&P 500 index, when ranked by market capitalization, make up 22% of the total market capitalization of the S&P 500 index. Numerical estimates of the mean (or expected) rates of return values of these top five stocks, expressed in decimal (not percentage) form, are listed in the table below. STOCK TICKER MEAN RETURN Apple, Inc. AAPL 0.69 Amazon.com Inc. AMZN 0.65 Microsoft Corp. MSFT 0.44 Alphabet, Inc. GOOG 0.36 Facebook, Inc. FB 0.41 The variance of returns (entries on the main diagonal) and covariances between returns of these top five stocks, expressed in decimal (not percentage) form, are as follows: AAPL AMZN MSFT GOOG FB AAPL 0.21 0.12 0.17 0.13 0.16 AMZN 0.12 0.15 0.12 0.10 0.12 MSFT 0.17 0.12 0.19 0.14 0.15 GOOG 0.13 0.10 0.14 0.15 0.14 FB 0.16 0.12 0.15 0.14 0.21 Assuming there is no risk-free asset available, suppose you desire to invest in a portfolio of these 5 stocks by minimizing the variance of your portfolio of 5 stocks, subject to the constraint that the weightings of each stock position sum to 1. Note that short positions are permissible. You are risk-averse and hope that a portfolio with variance less than or equal to 0.14 is attainable. A friend tells you that this is impossible since the stocks with the lowest variance from the table above, AMZN or GOOG, have a variance of 0.15. Using mean-variance portfolio optimization, determine the absolute minimum possible portfolio variance. Please express your numerical answer in decimal (not percentage) form and round your numerical answer to two decimal places