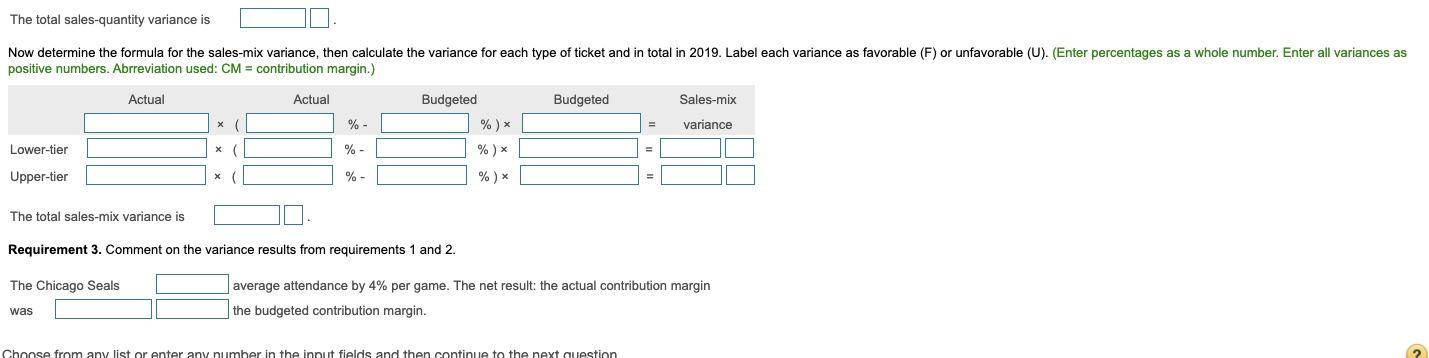
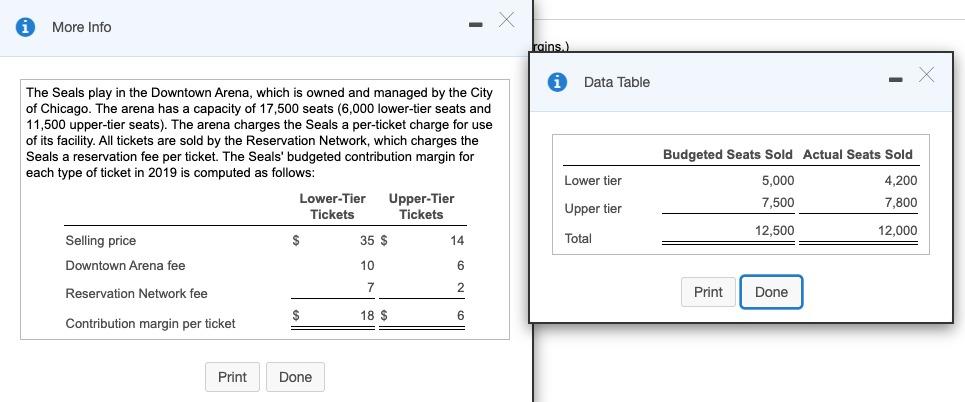
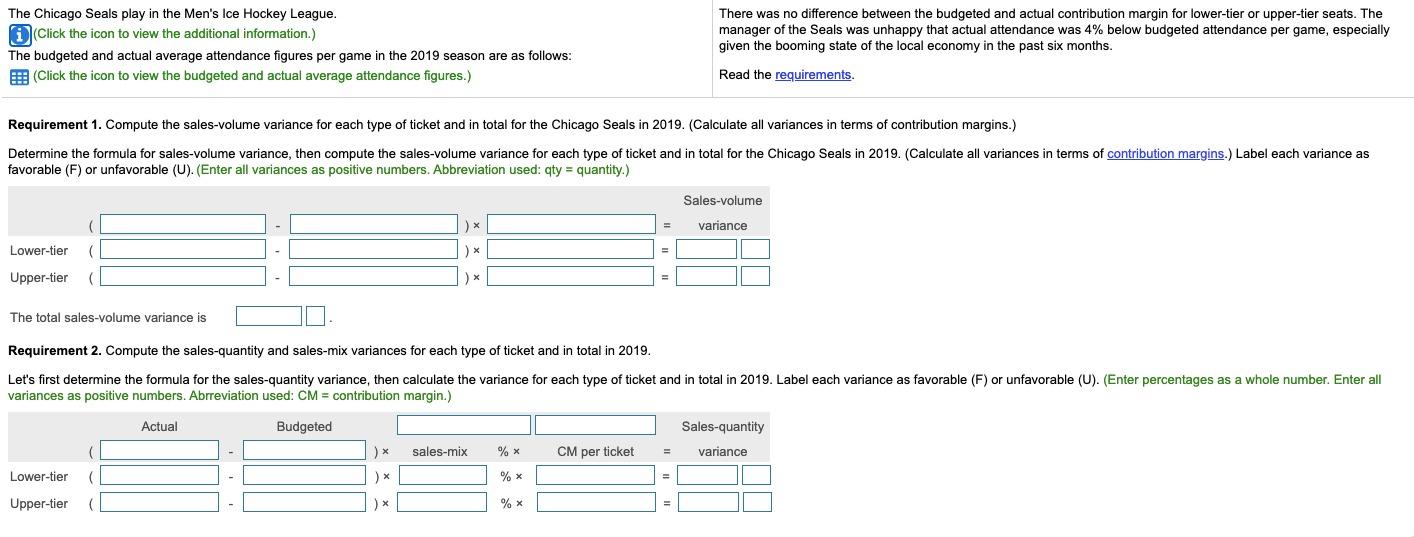
The total sales-quantity variance is Now determine the formula for the sales-mix variance, then calculate the variance for each type of ticket and in total in 2019. Label each variance as favorable (F) or unfavorable (U). (Enter percentages as a whole number. Enter all variances as positive numbers. Abrreviation used: CM = contribution margin.) Actual Actual Budgeted Sales-mix X % - Budgeted %) %) variance Lower-tier % - Upper-tier % - %) The total sales-mix variance is Requirement 3. Comment on the variance results from requirements 1 and 2. The Chicago Seals average attendance by 4% per game. The net result: the actual contribution margin the budgeted contribution margin. was Choose from any list or enter any number in the input fields and then continue to the next question More Info Foins Data Table The Seals play in the Downtown Arena, which is owned and managed by the City of Chicago. The arena has a capacity of 17,500 seats (6,000 lower-tier seats and 11,500 upper-tier seats). The arena charges the Seals a per-ticket charge for use of its facility. All tickets are sold by the Reservation Network, which charges the Seals a reservation fee per ticket. The Seals' budgeted contribution margin for each type of ticket in 2019 is computed as follows: Lower-Tier Upper-Tier Tickets Tickets Budgeted Seats Sold Actual Seats Sold Lower tier 5,000 7,500 4,200 7,800 Upper tier 12,500 12.000 35 $ 14 Total Selling price Downtown Arena fee 10 6 Reservation Network fee 7 2 Print Done $ 18 $ 6 Contribution margin per ticket Print Done The Chicago Seals play in the Men's Ice Hockey League. Click the icon to view the additional information.) The budgeted and actual average attendance figures per game in the 2019 season are as follows: (Click the icon to view the budgeted and actual average attendance figures. There was no difference between the budgeted and actual contribution margin for lower-tier or upper-tier seats. The manager of the Seals was unhappy that actual attendance was 4% below budgeted attendance per game, especially given the booming state of the local economy in the past six months. Read the requirements. Requirement 1. Compute the sales-volume variance for each type of ticket and in total for the Chicago Seals in 2019. (Calculate all variances in terms of contribution margins.) Determine the formula for sales-volume variance, then compute the sales-volume variance for each type of ticket and in total for the Chicago Seals in 2019. (Calculate all variances in terms of contribution margins.) Label each variance as favorable (F) or unfavorable (U). (Enter all variances as positive numbers. Abbreviation used: qty = quantity.) Sales-volume = variance Lower-tier ( ) Upper-tier ( The total sales volume variance is Requirement 2. Compute the sales-quantity and sales-mix variances for each type of ticket and in total in 2019. Let's first determine the formula for the sales-quantity variance, then calculate the variance for each type of ticket and in total in 2019. Label each variance as favorable (F) or unfavorable (U). (Enter percentages as a whole number. Enter all variances as positive numbers. Abrreviation used: CM = contribution margin.) Actual Budgeted Sales-quantity ) sales-mix % CM per ticket = variance Lower-tier ) X % x Upper-tier ( % x