

Answered step by step
Verified Expert Solution
Question
1 Approved Answer
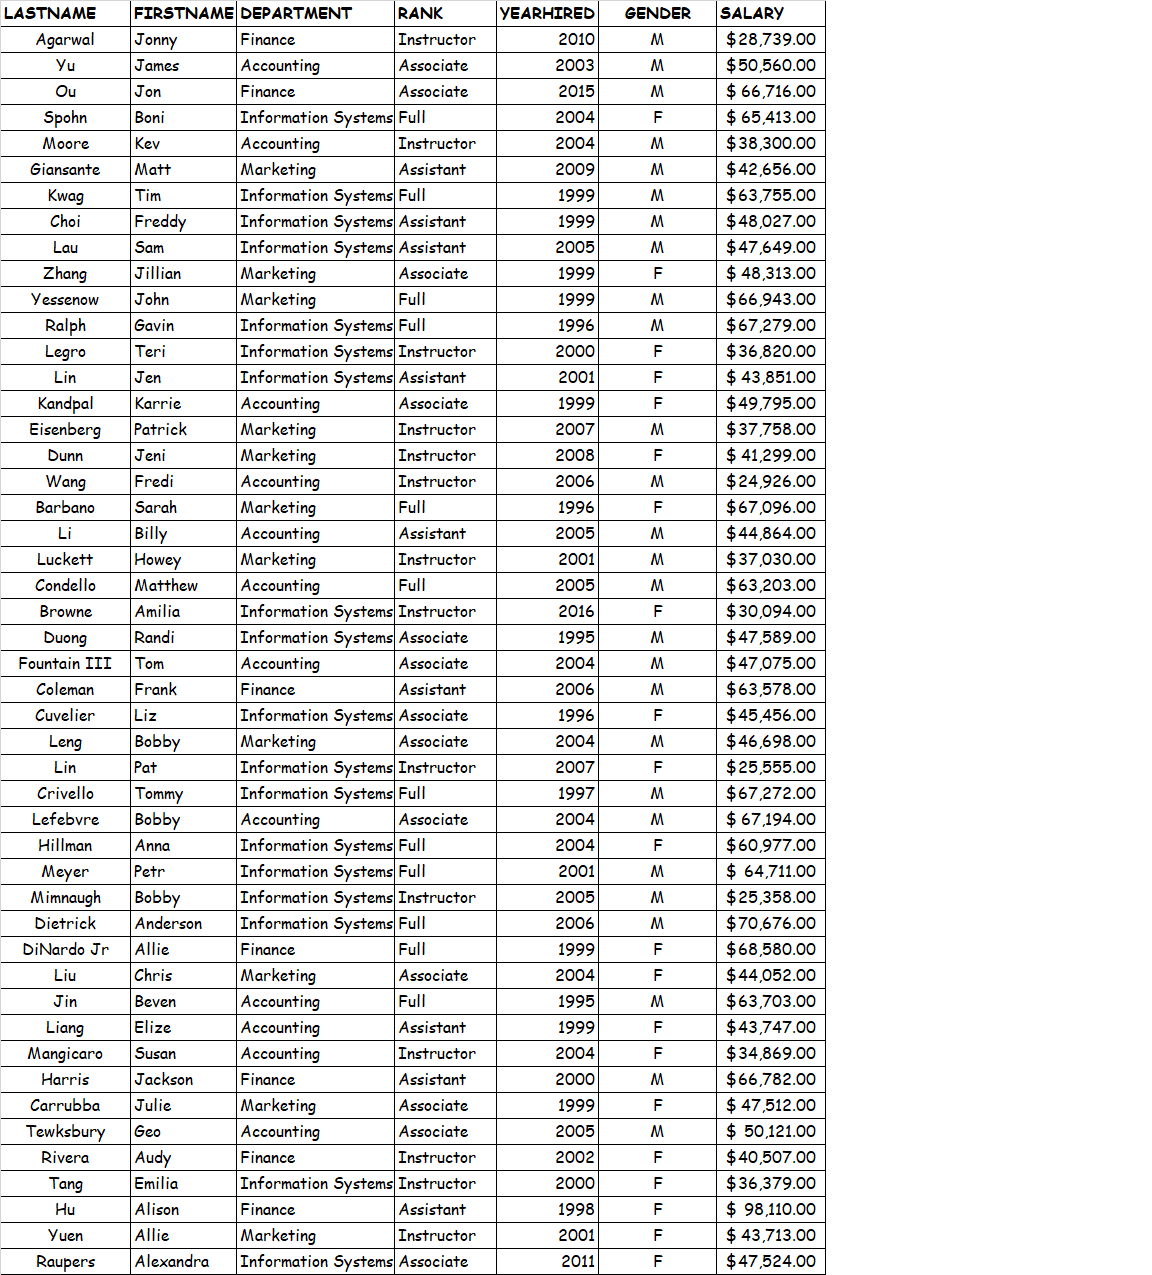
The Touring School of Business of the Impala University has 4 8 faculty members. The School has four departments Marketing, Finance, Accounting and Information Systems.
The Touring School of Business of the Impala University has faculty members. The School has four departments Marketing, Finance, Accounting and Information Systems. The raw data contains following details about each faculty member Last Name, First Name, Department, Rank, Year Hired, Gender and Salary.
Calculate Income tax: For the first $ no taxes are withheld. For anything above $ the amount above $ is taxed at
a Create a new column for Income Tax
b Compute income tax and place them in this column. HINT: You need an IF function here.
c Conditionally format the column such that if income tax is less than $ the cell is bold font and yellow colored text color only, NOT the fill color; if income tax is between $ and $ make the cell bold font and fill it with light blue color.
Sort the Faculty list by Department and then by Last name.
In a separate table below the given raw data table calculate the Sum, Average, Maximum, Minimum & percentage Salary for Each Department.
a Write the Department, Sum, Average, Maximum, Minimum & percentage Salary as Column heading.
b Write Department names under Department column.
c Compute Sum, Average, Maximum and Minimum for each department.
d Compute Sum of the salaries for all departments at the end of the Sum column in other words, total salaries for all the departments
e Compute percentage Salary of each department as Sum of Salary for the department divided by Total of Salaries for all departments.
Make a line chart to compare maximum, minimum and average salaries of each department NOTE: One line chart with THREE lines; each for max, min, and average; department names on xaxis and salaries on yaxis
a Give chart heading as Comparison of Departmental Salaries
b Make sure to name Xaxis label and series name.
c Make chart as a separate sheet call this sheet chart
Compare the average salary by Rank in a separate sheet
a Copy the raw data in an empty sheet HINT: copy raw data from first sheet and paste into second sheet
b Sort data by rank.
c Compute average salary by rank using subtotals.
d Name the sheet as Salary by Rank
Copy the raw data in a new sheet. On this new sheet, using the filter option in Excel, filter the list of male faculty hired on or after Name the sheet as Recent Faculty
Compare average salary between male and female for each department in a separate sheet
a Copy the raw data in an empty sheet HINT: copy raw data from first sheet and paste into second sheet
b Compute average salary for each department & within each department calculate average of salary for male and female faculties Use Subtotals
c Name the sheet as Salary Comparison
Step by Step Solution
There are 3 Steps involved in it
Step: 1

Get Instant Access to Expert-Tailored Solutions
See step-by-step solutions with expert insights and AI powered tools for academic success
Step: 2

Step: 3
Ace Your Homework with AI
Get the answers you need in no time with our AI-driven, step-by-step assistance
Get Started
Machine Learning And Knowledge Discovery In Databases European Conference Ecml Pkdd 2022 Grenoble France September 19 23 2022 Proceedings Part 4 Lnai 13716
Authors: Massih-Reza Amini ,Stephane Canu ,Asja Fischer ,Tias Guns ,Petra Kralj Novak ,Grigorios Tsoumakas
1st Edition
3031264118, 978-3031264115