Answered step by step
Verified Expert Solution
Link Copied!

Question

1 Approved Answer

The trade volume of a stock is the number of shares traded on a given day. The data in the first accompanying?table, in millions?(so that

The trade volume of a stock is the number of shares traded on a given day. The data in the first accompanying?table, in millions?(so that 6.36 represents 6,360,000 shares?traded), represent the volume of a certain stock traded for a random sample of 40 trading days in a certain year. A second random sample of 40 days in the same year resulted in the data in second accompanying table. Complete parts?(a) through?(d) below.
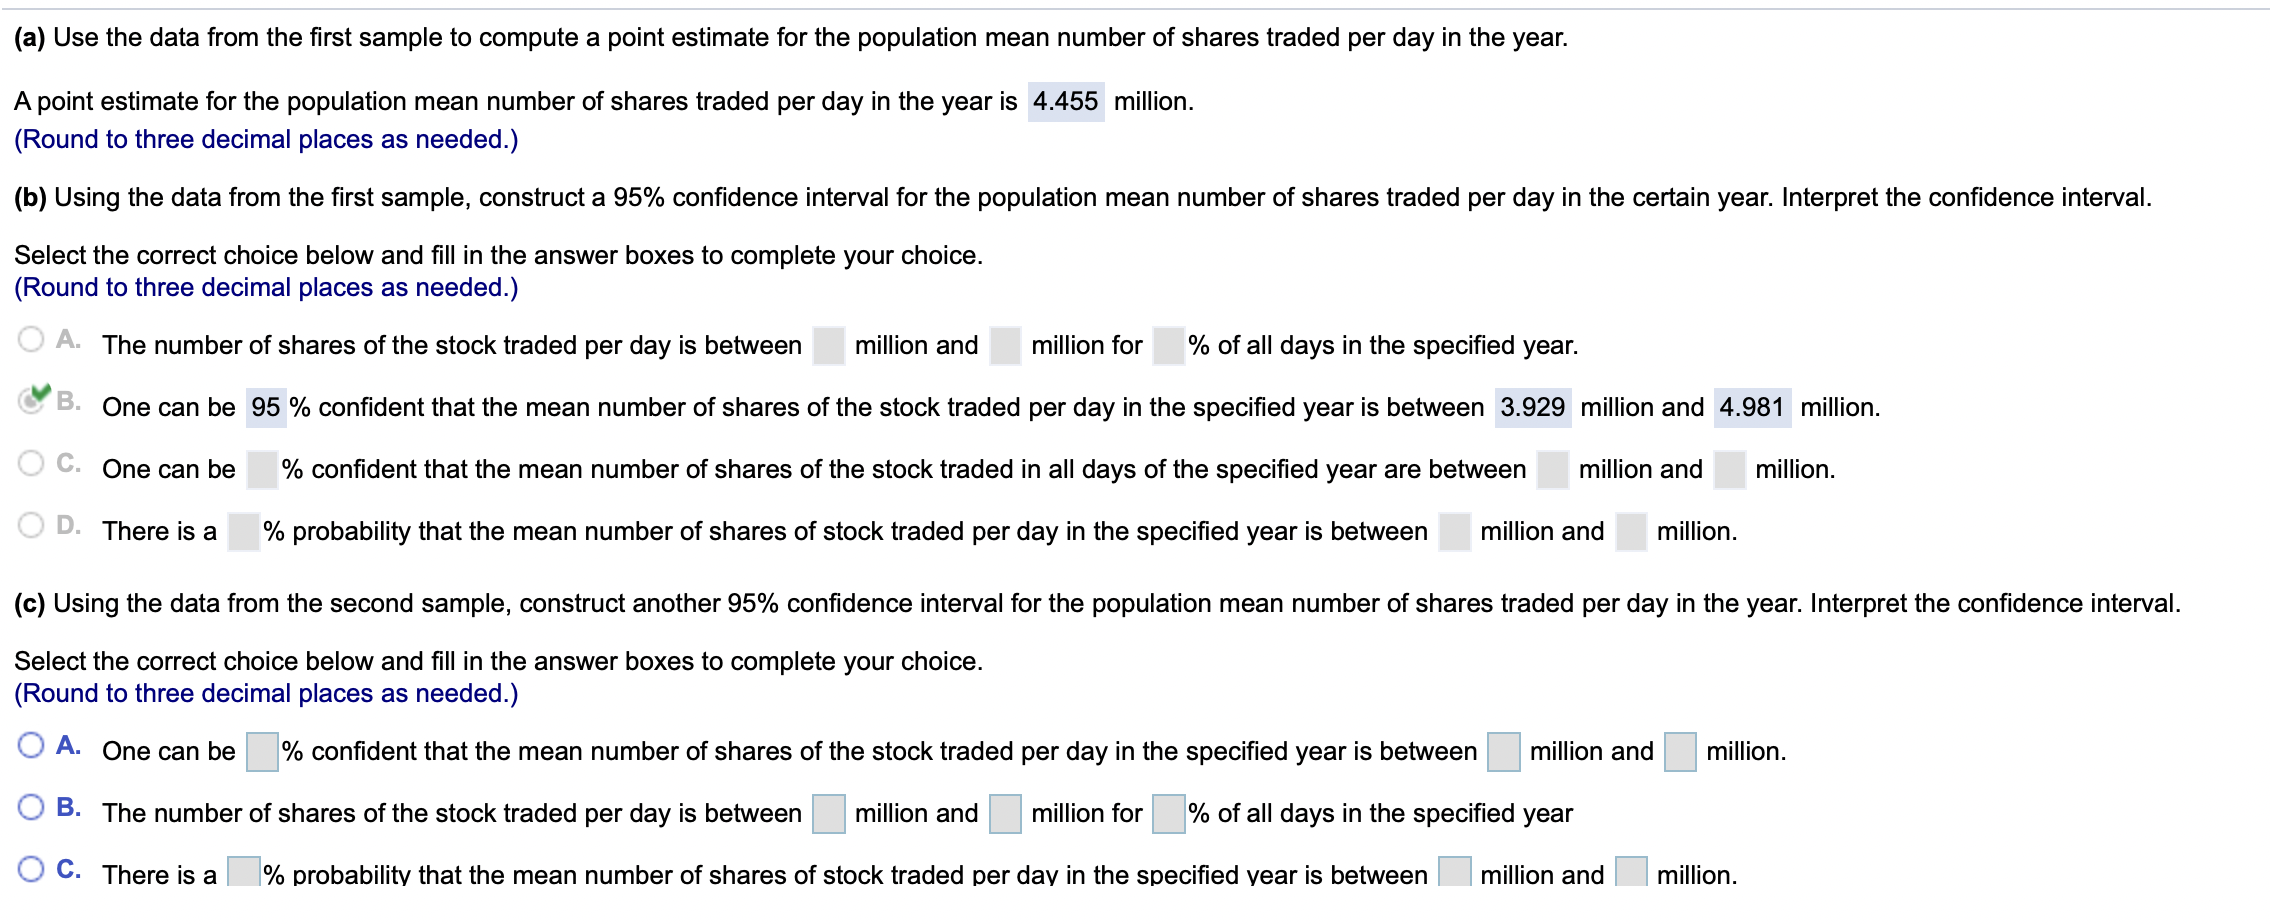
image text in transcribedimage text in transcribed
(a) Use the data from the first sample to compute a point estimate for the population mean number of shares traded per day in the year. A point estimate for the population mean number of shares traded per day in the year is 4.455 million. (Round to three decimal places as needed.) (b) Using the data from the first sample, construct a 95% confidence interval for the population mean number of shares traded per day in the certain year. Interpret the confidence interval. Select the correct choice below and fill in the answer boxes to complete your choice. (Round to three decimal places as needed.) O A. The number of shares of the stock traded per day is between million and million for % of all days in the specified year. B. One can be 95 % confident that the mean number of shares of the stock traded per day in the specified year is between 3.929 million and 4.981 million. O C. One can be % confident that the mean number of shares of the stock traded in all days of the specified year are between million and million. O D. There is a % probability that the mean number of shares of stock traded per day in the specified year is between million and million. (c) Using the data from the second sample, construct another 95% confidence interval for the population mean number of shares traded per day in the year. Interpret the confidence interval. Select the correct choice below and fill in the answer boxes to complete your choice. (Round to three decimal places as needed.) O A. One can be % confident that the mean number of shares of the stock traded per day in the specified year is between million and million. O B. The number of shares of the stock traded per day is between million and million for % of all days in the specified year O C. There is a % probability that the mean number of shares of stock traded per day in the specified year is between | million and million.7.46 4.52 2.36 7.48 9.00 3.60 6.70 9.08 10.38 4.76 6.64 4.88 4.48 5.48 2.74 3.20 3.42 3.28 4.40 2.86 2.96 4.10 7.50 6.60 5.50 4.88 3.34 2.76 6.24 3.38 3.58 4.10 7.18 3.52 4.40 3.08 1.68 4.38 3.38 3.54

Step by Step Solution

There are 3 Steps involved in it

Step: 1

blur-text-image

Get Instant Access to Expert-Tailored Solutions

See step-by-step solutions with expert insights and AI powered tools for academic success

Step: 2

blur-text-image

Step: 3

blur-text-image

Ace Your Homework with AI

Get the answers you need in no time with our AI-driven, step-by-step assistance

Get Started

Recommended Textbook for

Intermediate Algebra

Authors: Marvin L Bittinger

11th Edition

0321968395, 9780321968395

More Books

Students also viewed these Mathematics questions