

Answered step by step
Verified Expert Solution
Question
1 Approved Answer
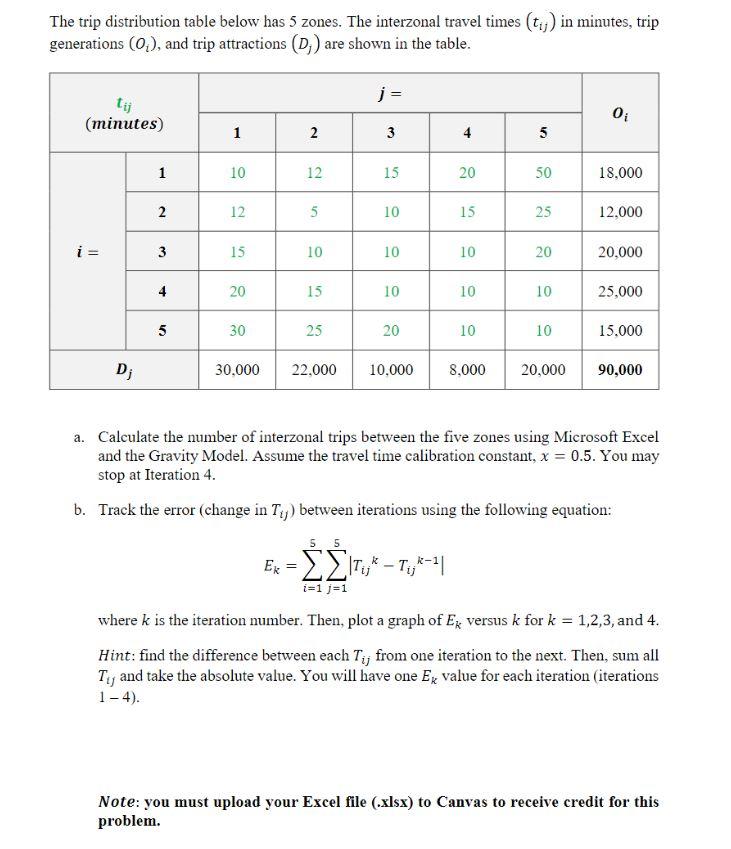
The trip distribution table below has 5 zones. The interzonal travel times (tij) in minutes, trip generations (Oi), and trip attractions (Dj) are shown in
Step by Step Solution
There are 3 Steps involved in it
Step: 1

Get Instant Access to Expert-Tailored Solutions
See step-by-step solutions with expert insights and AI powered tools for academic success
Step: 2

Step: 3
Ace Your Homework with AI
Get the answers you need in no time with our AI-driven, step-by-step assistance
Get Started
Transportation Division Department Of Commerce Report On Preliminary Performance Audit Survey
Authors: Montana. Legislature. Office Of The Legi
1st Edition
1245445294, 978-1245445290