Answered step by step
Verified Expert Solution
Link Copied!

Question

1 Approved Answer

The two dot plots below show the heights of some sixth graders and some seventh graders: Sixth Graders 52 53 54 55 56 57. Height
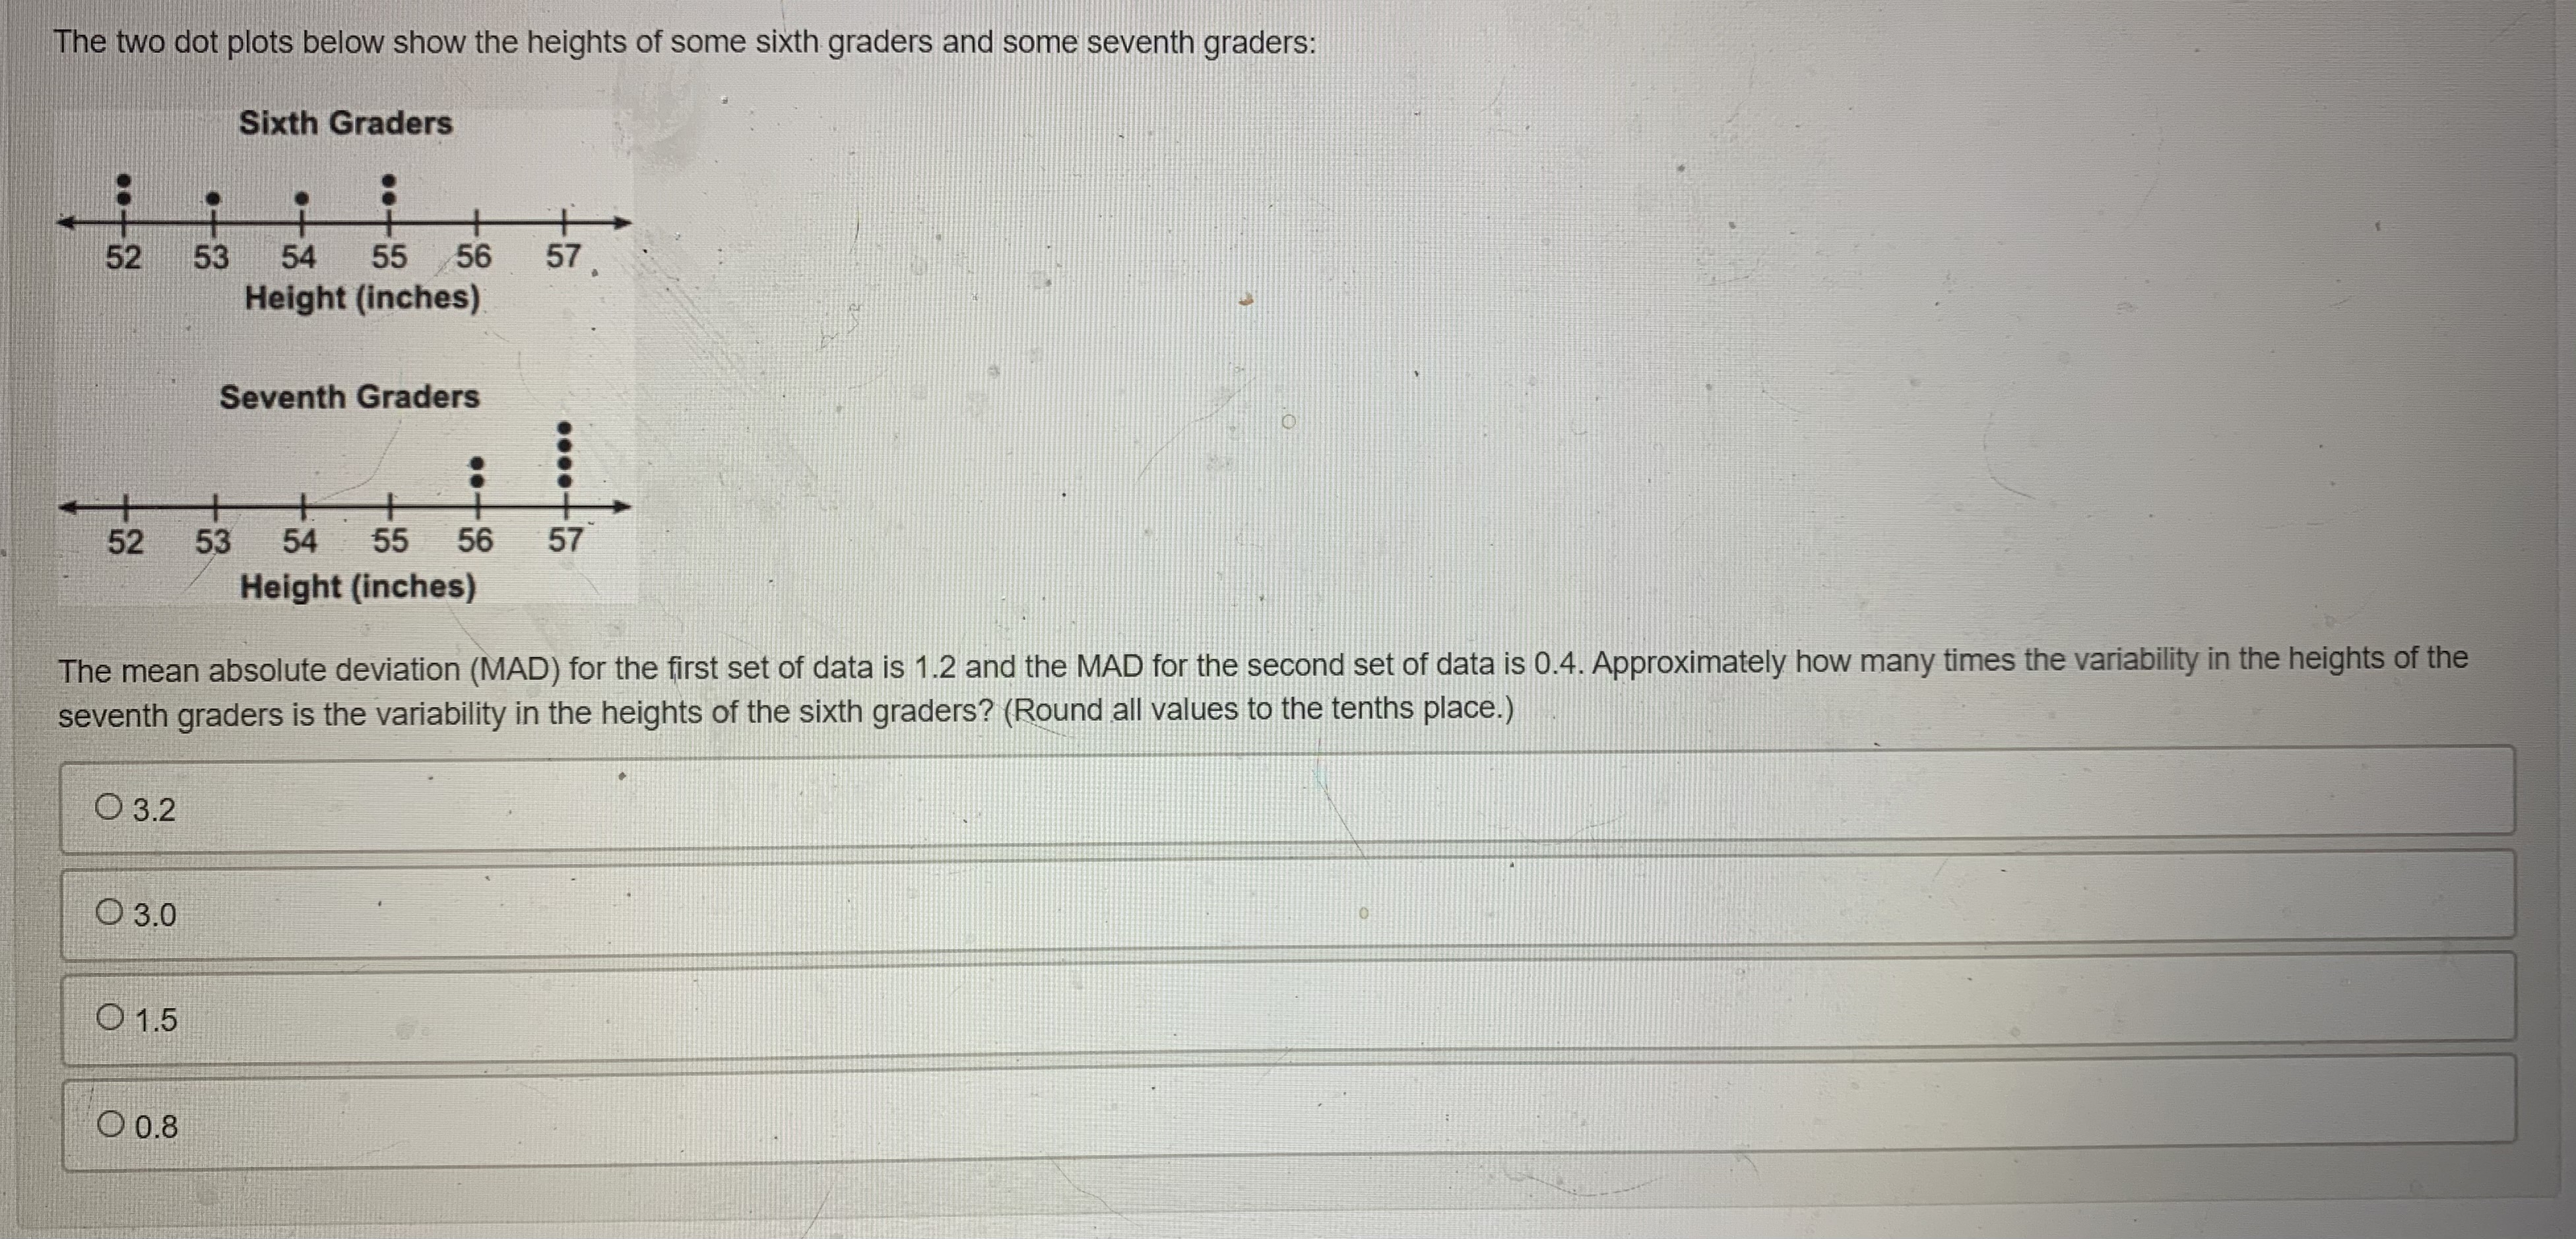
image text in transcribed
The two dot plots below show the heights of some sixth graders and some seventh graders: Sixth Graders 52 53 54 55 56 57. Height (inches) Seventh Graders O .... 52 53 54 55 56 57 Height (inches) The mean absolute deviation (MAD) for the first set of data is 1.2 and the MAD for the second set of data is 0.4. Approximately how many times the variability in the heights of the seventh graders is the variability in the heights of the sixth graders? (Round all values to the tenths place.) O 3.2 O 3.0 O 1.5 O 0.8

Step by Step Solution

There are 3 Steps involved in it

Step: 1

blur-text-image

Get Instant Access to Expert-Tailored Solutions

See step-by-step solutions with expert insights and AI powered tools for academic success

Step: 2

blur-text-image

Step: 3

blur-text-image

Ace Your Homework with AI

Get the answers you need in no time with our AI-driven, step-by-step assistance

Get Started

Recommended Textbook for

Linear Algebra With Applications

Authors: Gareth Williams, Williams

9th Edition

1284120104, 9781284120103

More Books

Students also viewed these Mathematics questions

Question

Describe three other types of visual aids.

Answered: 1 week ago