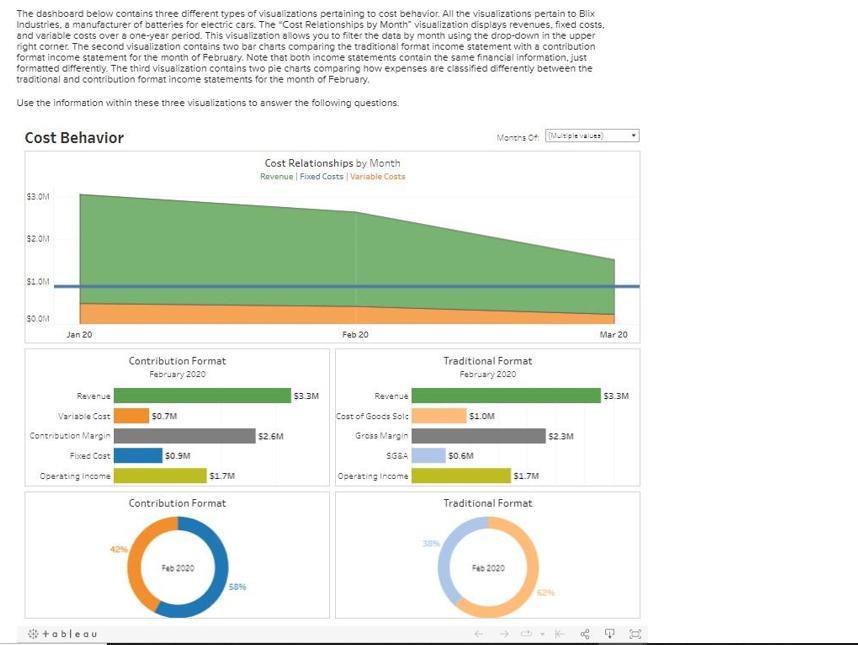
The two pie charts show the proportion of each expense type for both the contribution format and traditional format. Pie charts can be especially useful

The two pie charts show the proportion of each expense type for both the contribution format and traditional format. Pie charts can be especially useful in quickly determining how a company’s cost is structured. Operating leverage is a metric often utilized to evaluate the cost structure of a company. Calculate the best describes the extent of operating leverage for this company?
The dashboard below contains three different types of visualizations pertaining to cost behavior. All the visualizations pertain to Blix Industries, a manufacturer of batteries for electric cars. The "Cost Relationships by Month visualization displays revenues, fixed costs. and variable costs over a one-year period. This visualization allows you to filter the data by month using the drop-down in the upper right corner. The second visualization contains two bar charts comparing the traditional format income statement with a contribution format income statement for the month of February. Note that both income statements contain the same financial information, just formatted differently. The third visualization contains two pie charts comparing how expenses are classified differently between the traditional and contribution format income statements for the month of February. Use the information within these three visualizations to answer the following questions. Cost Behavior $3.0M $2.0M $1.0M 50.0M Jan 20 Revenue Variable Cost Contribution Margin Fixed Cost Operating income +ableau Contribution Format February 2020 $0.7M $0.9M $1.7M Contribution Format 58% Cost Relationships by Month Revenue | Fixed Costs | Variable Costs $2.6M $3.3M Feb 20 Revenue Cost of Goods Solc Gross Margin SG&A Operating Income Traditional Format February 2020 $1.0M Months Of Multiple values) 50.6M $1.7M Traditional Format Feb 2020 $2.3M Mar 20 $3.3M
Step by Step Solution
3.51 Rating (151 Votes )
There are 3 Steps involved in it
Step: 1
Step 12 Operating leverage It refers to the analysis of measuring the share of fixed cost and variab...
See step-by-step solutions with expert insights and AI powered tools for academic success
Step: 2

Step: 3

Ace Your Homework with AI
Get the answers you need in no time with our AI-driven, step-by-step assistance
Get Started


