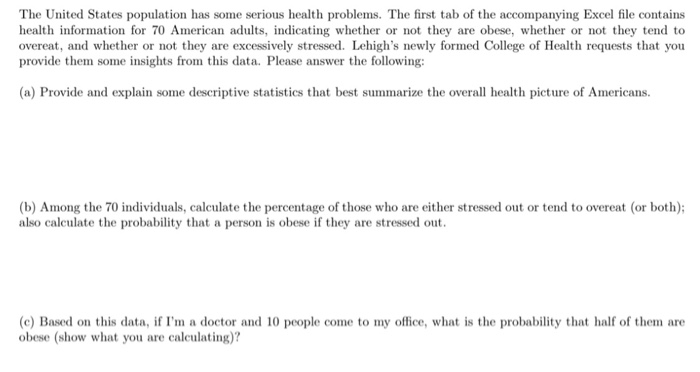
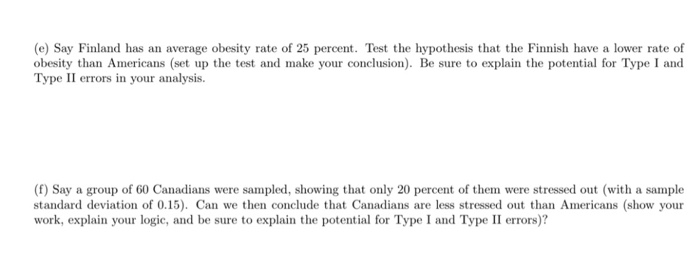
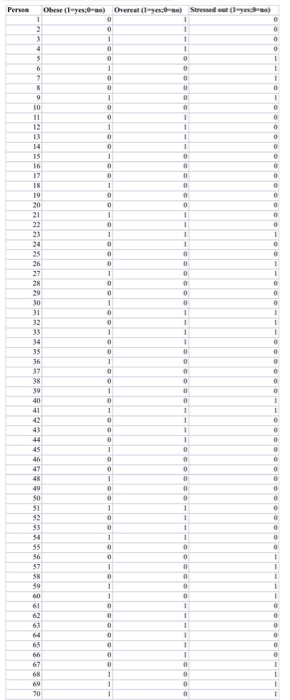
The United States population has some serious health problems. The first tab of the accompanying Excel file contains health information for 70 American adults, indicating whether or not they are obese, whether or not they tend to overeat, and whether or not they are excessively stressed. Lehigh's newly formed College of Health requests that you provide them some insights from this data. Please answer the following: (a) Provide and explain some descriptive statistics that best summarize the overall health picture of Americans. (b) Among the 70 individuals, calculate the percentage of those who are either stressed out or tend to overeat (or both); also calculate the probability that a person is obese if they are stressed out. (c) Based on this data, if I'm a doctor and 10 people come to my office, what is the probability that half of them are obese (show what you are calculating)? (e) Say Finland has an average obesity rate of 25 percent. Test the hypothesis that the Finnish have a lower rate of obesity than Americans (set up the test and make your conclusion). Be sure to explain the potential for Type I and Type II errors in your analysis. (f) Say a group of 60 Canadians were sampled, showing that only 20 percent of them were stressed out with a sample standard deviation of 0.15). Can we then conclude that Canadians are less stressed out than Americans (show your work, explain your logic, and be sure to explain the potential for Type I and Type II errors)? 292222 Sot C eles ---eeeeee-e-O-OOOOO ) Cheral (1 ) Streda The United States population has some serious health problems. The first tab of the accompanying Excel file contains health information for 70 American adults, indicating whether or not they are obese, whether or not they tend to overeat, and whether or not they are excessively stressed. Lehigh's newly formed College of Health requests that you provide them some insights from this data. Please answer the following: (a) Provide and explain some descriptive statistics that best summarize the overall health picture of Americans. (b) Among the 70 individuals, calculate the percentage of those who are either stressed out or tend to overeat (or both); also calculate the probability that a person is obese if they are stressed out. (c) Based on this data, if I'm a doctor and 10 people come to my office, what is the probability that half of them are obese (show what you are calculating)? (e) Say Finland has an average obesity rate of 25 percent. Test the hypothesis that the Finnish have a lower rate of obesity than Americans (set up the test and make your conclusion). Be sure to explain the potential for Type I and Type II errors in your analysis. (f) Say a group of 60 Canadians were sampled, showing that only 20 percent of them were stressed out with a sample standard deviation of 0.15). Can we then conclude that Canadians are less stressed out than Americans (show your work, explain your logic, and be sure to explain the potential for Type I and Type II errors)? 292222 Sot C eles ---eeeeee-e-O-OOOOO ) Cheral (1 ) Streda


