

Answered step by step
Verified Expert Solution
Question
1 Approved Answer
The units produced and labor hours for September to December are given in the following table. Fill in the table by calculating a ) the
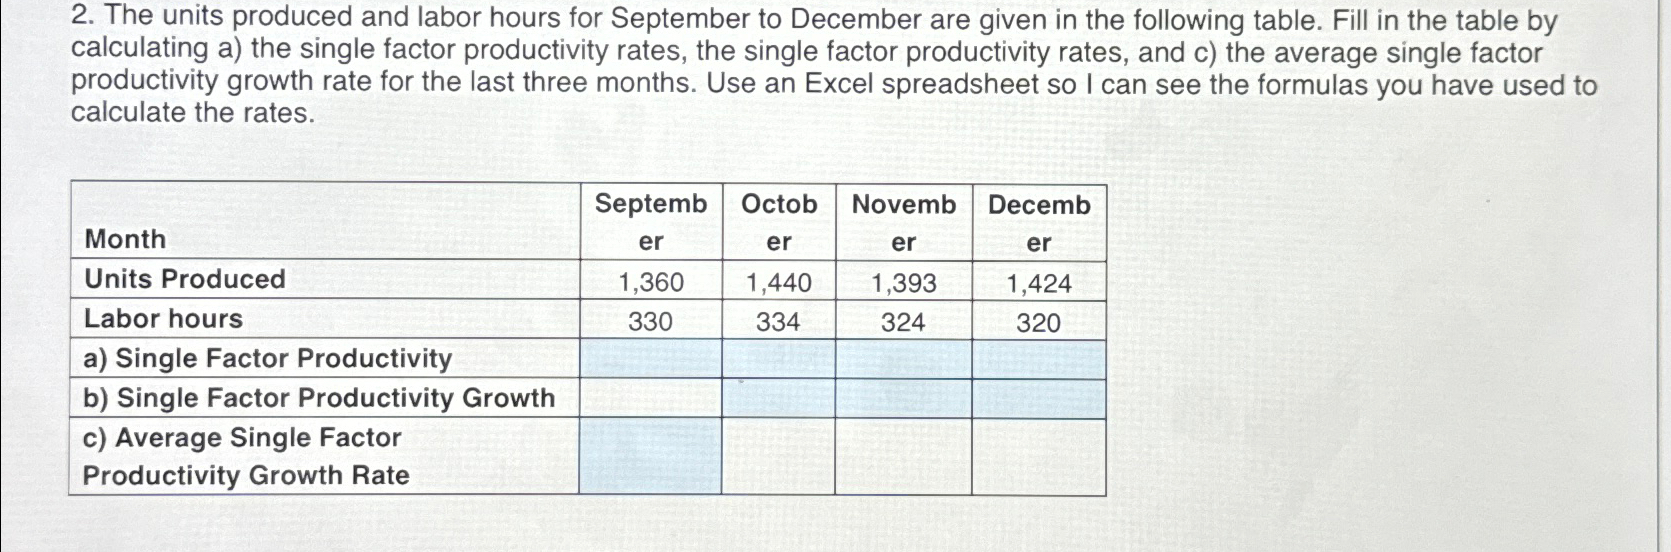
The units produced and labor hours for September to December are given in the following table. Fill in the table by calculating a the single factor productivity rates, the single factor productivity rates, and c the average single factor productivity growth rate for the last three months. Use an Excel spreadsheet so I can see the formulas you have used to calculate the rates.
tableMonthtableSeptembertableOctobertableNovembertableDecemberUnits Produced,Labor hours,a Single Factor Productivity,,,,b Single Factor Productivity Growth,,,,tablec Average Single FactorProductivity Growth Rate
Step by Step Solution
There are 3 Steps involved in it
Step: 1

Get Instant Access to Expert-Tailored Solutions
See step-by-step solutions with expert insights and AI powered tools for academic success
Step: 2

Step: 3
Ace Your Homework with AI
Get the answers you need in no time with our AI-driven, step-by-step assistance
Get Started
Life Audit Workbook Meant For More
Authors: Agnese Iskrova
1st Edition
1716274958, 978-1716274954