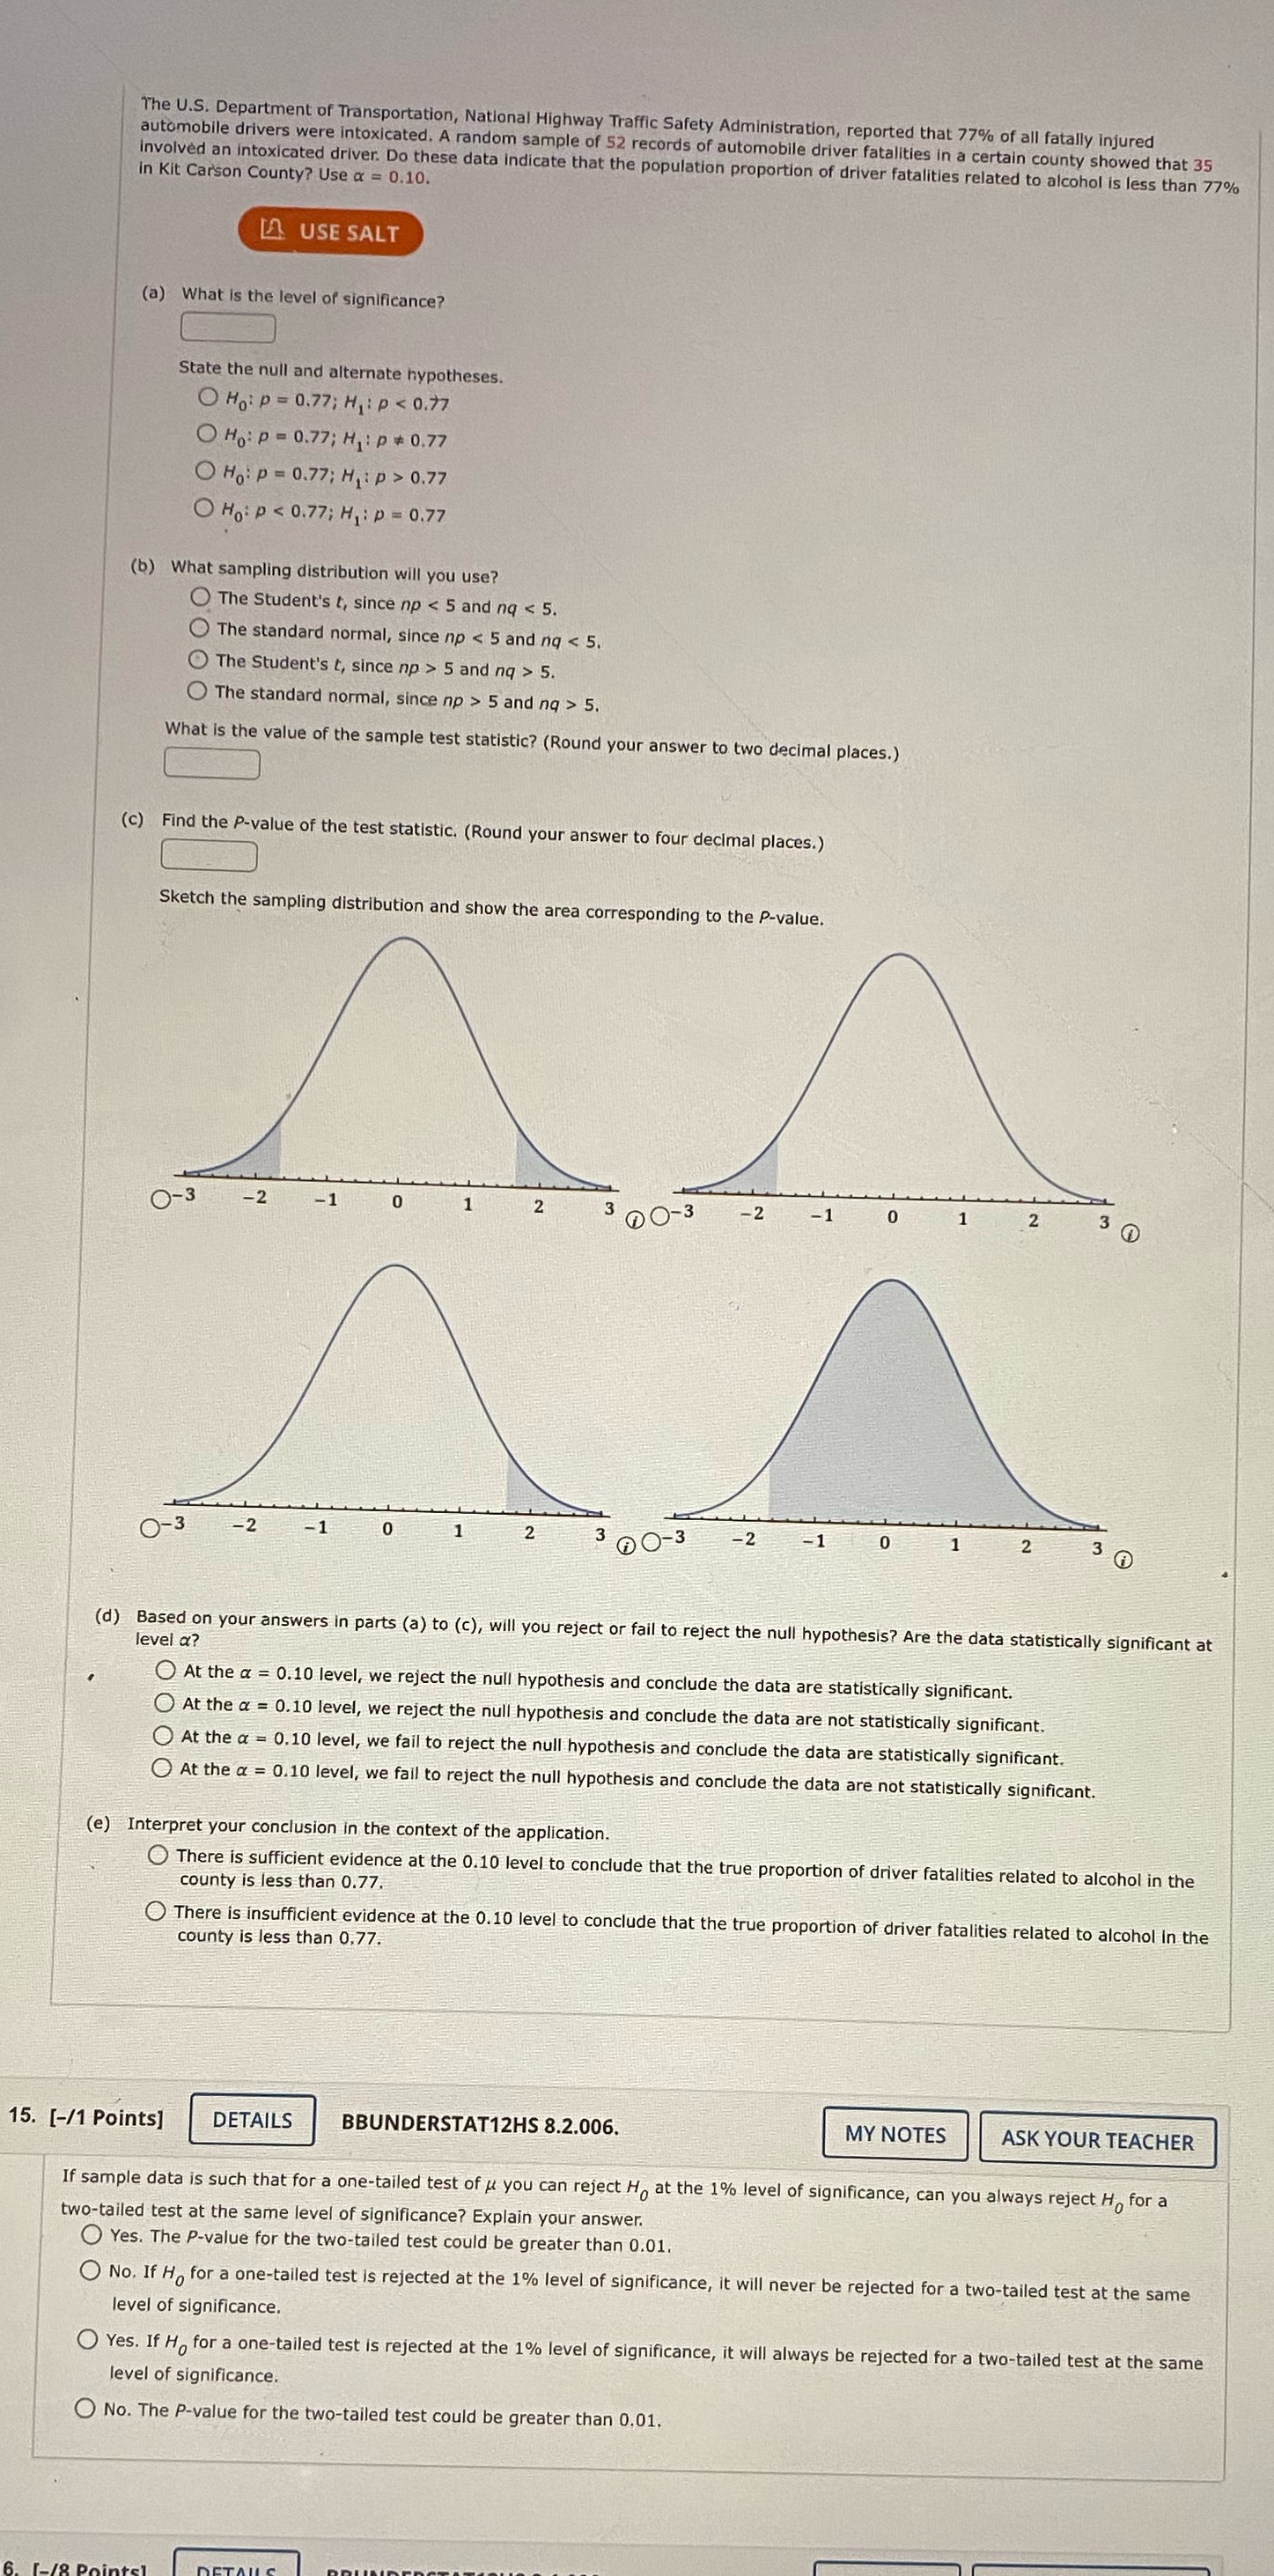
The U.S. Department of Transportation, National Highway Traffic Safety Administration, reported that 77% of all fatally injured automobile drivers were intoxicated. A random sample of 52 records of automobile driver fatalities in a certain county showed that 35 involved an intoxicated driver. Do these data indicate that the population proportion of driver fatalities related to alcohol is less than 77% in Kit Carson County? Use a = 0.10. LA USE SALT (a) What is the level of significance? State the null and alternate hypotheses. O Hoip = 0.77; Hip 0.77 O Ho: p 5 and nq > 5. The standard normal, since np > 5 and nq > 5. What is the value of the sample test statistic? (Round your answer to two decimal places.) (c) Find the P-value of the test statistic. (Round your answer to four decimal places.) Sketch the sampling distribution and show the area corresponding to the P-value. O-3 -2 -1 0 1 2 -2 2 O-3 -2 )-3 -2 (d) Based on your answers in parts (a) to (c), will you reject or fail to reject the null hypothesis? Are the data statistically significant at level a? O At the a = 0.10 level, we reject the null hypothesis and conclude the data are statistically significant. At the a = 0.10 level, we reject the null hypothesis and conclude the data are not statistically significant. O At the a = 0.10 level, we fail to reject the null hypothesis and conclude the data are statistically significant. At the a = 0.10 level, we fail to reject the null hypothesis and conclude the data are not statistically significant. (e) Interpret your conclusion in the context of the application. There is sufficient evidence at the 0.10 level to conclude that the true proportion of driver fatalities related to alcohol in the county is less than 0.77. There is insufficient evidence at the 0.10 level to conclude that the true proportion of driver fatalities related to alcohol In the county is less than 0,77. 15. [-/1 Points] DETAILS BBUNDERSTAT12HS 8.2.006. MY NOTES ASK YOUR TEACHER If sample data is such that for a one-tailed test of u you can reject Ho at the 1% level of significance, can you always reject H, for a two-tailed test at the same level of significance? Explain your answer. Yes. The P-value for the two-tailed test could be greater than 0.01. O No. If Ho for a one-tailed test is rejected at the 1% level of significance, it will never be rejected for a two-tailed test at the same level of significance. Yes. If Ho for a one-tailed test is rejected at the 1% level of significance, it will always be rejected for a two-tailed test at the same level of significance. No. The P-value for the two-tailed test could be greater than 0.01


