

Answered step by step
Verified Expert Solution
Question
1 Approved Answer
the values are now given, can you help me with the other questions 2 and 3 plzz asap I REALLY NEED HELP WITH THIS ASAP
 the values are now given, can you help me with the other questions
2 and 3 plzz asap
I REALLY NEED HELP WITH THIS ASAP
THANK YOU
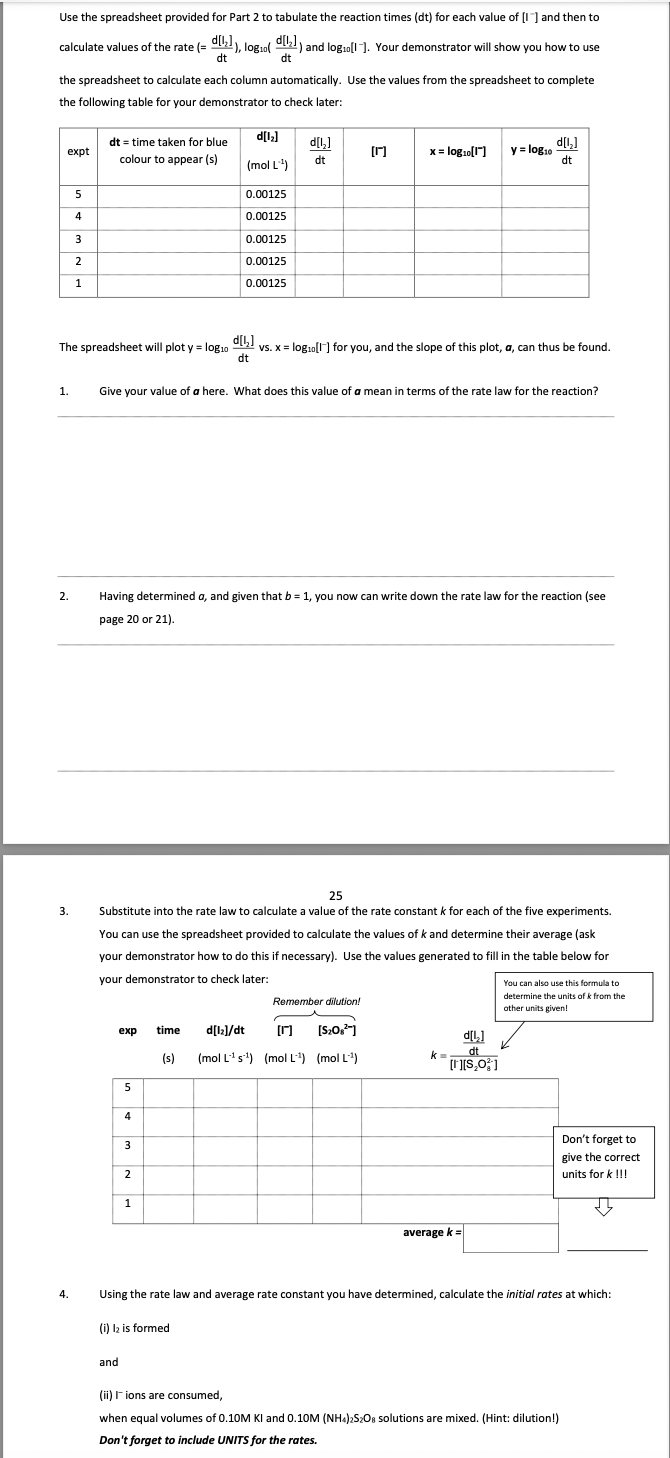
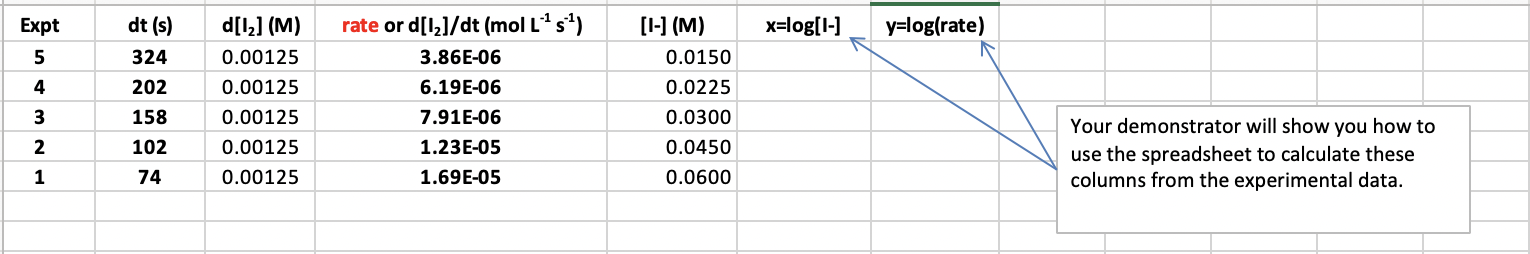
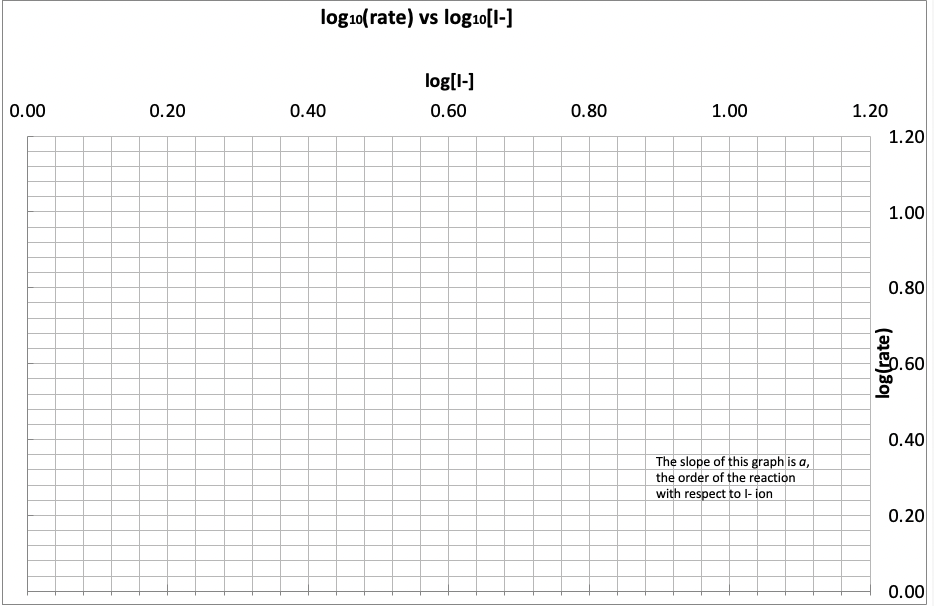
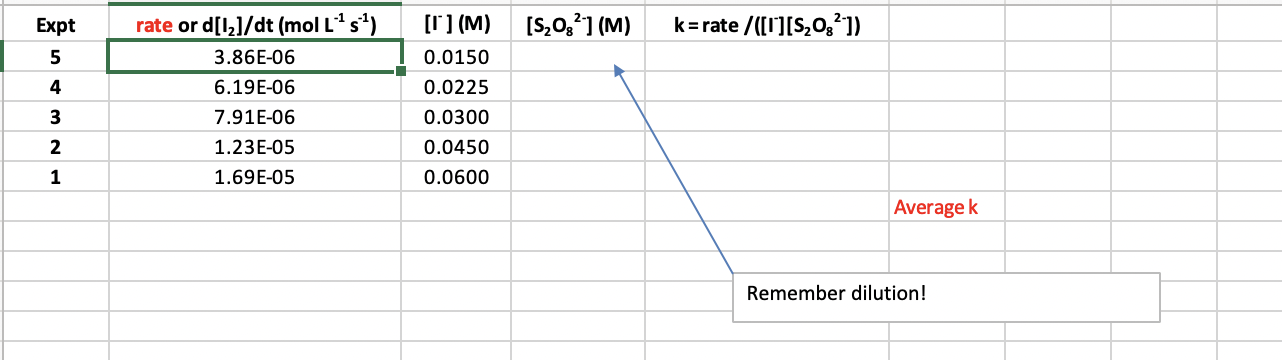
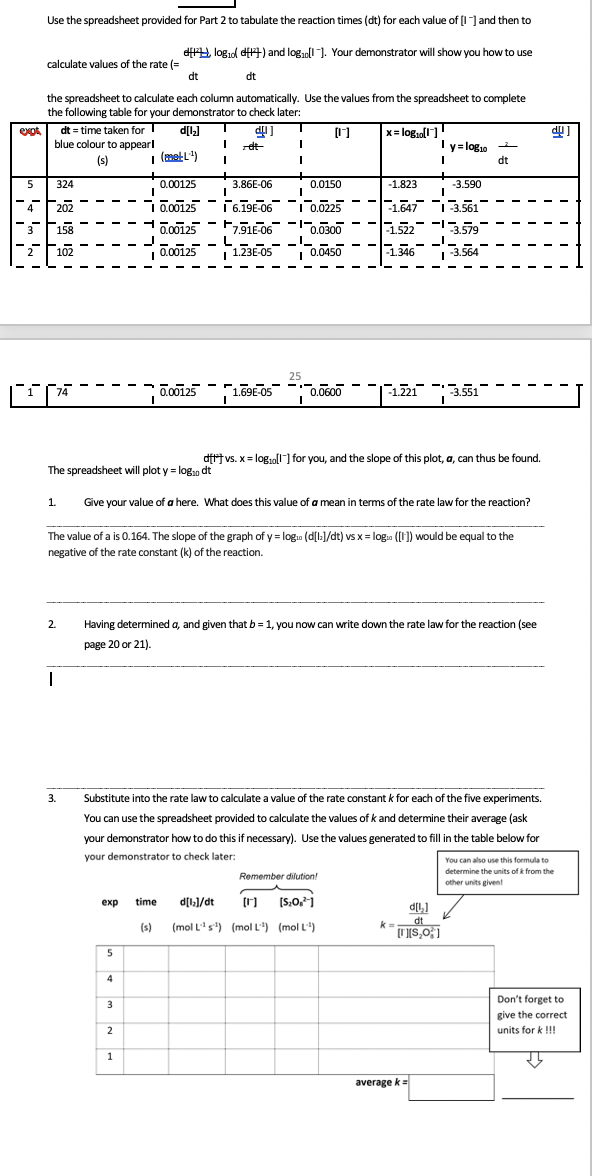
Use the spreadsheet provided for Part 2 to tabulate the reaction times (dt) for each value of [I]and then to calculate values of the rate (=dtd[I2]),log10(dtd[I2]) and log10[1]. Your demonstrator will show you how to use the spreadsheet to calculate each column automatically. Use the values from the spreadsheet to complete the following table for your demonstrator to check later: The spreadsheet will plot y=log10dtd[l2] vs. x=log10[I]for you, and the slope of this plot, a, can thus be found. 1. Give your value of a here. What does this value of a mean in terms of the rate law for the reaction? 2. Having determined a, and given that b=1, you now can write down the rate law for the reaction (see page 20 or 21 ). 3. Substitute into the rate law to calculate a value of the rate constant k for each of the five experiments. You can use the spreadsheet provided to calculate the values of k and determine their average (ask your demonstrator how to do this if necessary). Use the values generated to fill in the table below for 4. Using the rate law and average rate constant you have determined, calculate the initial rates at which: (i) I2 is formed and (ii) I- ions are consumed, when equal volumes of 0.10MKI and 0.10M(NH8)2S2O8 solutions are mixed. (Hint: dilution!) Don't forget to include UNITS for the rates. \begin{tabular}{|c|c|c|c|c|c|c|} \hline Expt & dt(s) & d[I2](M) & rate or d[I2]/dt(molL1s1) & {[I](M)} & x=log[I] & y=log(rate) \\ \hline 5 & 324 & 0.00125 & 3.86E06 & 0.0150 & \\ \hline 4 & 202 & 0.00125 & 6.19E06 & 0.0225 & \\ \hline 3 & 158 & 0.00125 & 7.91E06 & 0.0300 & \\ \hline 2 & 102 & 0.00125 & 1.23E05 & 0.0450 & \\ \hline 1 & 74 & 0.00125 & 1.69E05 & 0.0600 & \\ \hline \end{tabular} Your demonstrator will show you how to use the spreadsheet to calculate these columns from the experimental data. log10( rate) vs log10[1] Use the spreadsheet provided for Part 2 to tabulate the reaction times (dt) for each value of [1 ]and then to calculate values of the rate (= d(1+log10(d(1+) and log10[1. Your demonstrator will show you how to use dt the spreadsheet to calculate each column automatically. Use the values from the spreadsheet to complete the following table for your demonstrator to check later: dfit vs. x=log10llfor you, and the slope of this plot, a, can thus be found. The spreadsheet will plot y=log10dt 1. Give your value of a here. What does this value of a mean in terms of the rate law for the reaction? The value of a is 0.164. The slope of the graph of y=log10(d[l1]/dt) vs x=log10([I]) would be equal to the negative of the rate constant (k) of the reaction. 2. Having determined a, and given that b=1, you now can write down the rate law for the reaction (see page 20 or 21 ). 3. Substitute into the rate law to calculate a value of the rate constant k for each of the five experiments. You can use the spreadsheet provided to calculate the values of k and determine their average (ask your demonstrator how to do this if necessary). Use the values generated to fill in the table below for your demonstrator to check later: Use the spreadsheet provided for Part 2 to tabulate the reaction times (dt) for each value of [I]and then to calculate values of the rate (=dtd[I2]),log10(dtd[I2]) and log10[1]. Your demonstrator will show you how to use the spreadsheet to calculate each column automatically. Use the values from the spreadsheet to complete the following table for your demonstrator to check later: The spreadsheet will plot y=log10dtd[l2] vs. x=log10[I]for you, and the slope of this plot, a, can thus be found. 1. Give your value of a here. What does this value of a mean in terms of the rate law for the reaction? 2. Having determined a, and given that b=1, you now can write down the rate law for the reaction (see page 20 or 21 ). 3. Substitute into the rate law to calculate a value of the rate constant k for each of the five experiments. You can use the spreadsheet provided to calculate the values of k and determine their average (ask your demonstrator how to do this if necessary). Use the values generated to fill in the table below for 4. Using the rate law and average rate constant you have determined, calculate the initial rates at which: (i) I2 is formed and (ii) I- ions are consumed, when equal volumes of 0.10MKI and 0.10M(NH8)2S2O8 solutions are mixed. (Hint: dilution!) Don't forget to include UNITS for the rates. \begin{tabular}{|c|c|c|c|c|c|c|} \hline Expt & dt(s) & d[I2](M) & rate or d[I2]/dt(molL1s1) & {[I](M)} & x=log[I] & y=log(rate) \\ \hline 5 & 324 & 0.00125 & 3.86E06 & 0.0150 & \\ \hline 4 & 202 & 0.00125 & 6.19E06 & 0.0225 & \\ \hline 3 & 158 & 0.00125 & 7.91E06 & 0.0300 & \\ \hline 2 & 102 & 0.00125 & 1.23E05 & 0.0450 & \\ \hline 1 & 74 & 0.00125 & 1.69E05 & 0.0600 & \\ \hline \end{tabular} Your demonstrator will show you how to use the spreadsheet to calculate these columns from the experimental data. log10( rate) vs log10[1] Use the spreadsheet provided for Part 2 to tabulate the reaction times (dt) for each value of [1 ]and then to calculate values of the rate (= d(1+log10(d(1+) and log10[1. Your demonstrator will show you how to use dt the spreadsheet to calculate each column automatically. Use the values from the spreadsheet to complete the following table for your demonstrator to check later: dfit vs. x=log10llfor you, and the slope of this plot, a, can thus be found. The spreadsheet will plot y=log10dt 1. Give your value of a here. What does this value of a mean in terms of the rate law for the reaction? The value of a is 0.164. The slope of the graph of y=log10(d[l1]/dt) vs x=log10([I]) would be equal to the negative of the rate constant (k) of the reaction. 2. Having determined a, and given that b=1, you now can write down the rate law for the reaction (see page 20 or 21 ). 3. Substitute into the rate law to calculate a value of the rate constant k for each of the five experiments. You can use the spreadsheet provided to calculate the values of k and determine their average (ask your demonstrator how to do this if necessary). Use the values generated to fill in the table below for your demonstrator to check laterStep by Step Solution
There are 3 Steps involved in it
Step: 1

Get Instant Access to Expert-Tailored Solutions
See step-by-step solutions with expert insights and AI powered tools for academic success
Step: 2

Step: 3
Ace Your Homework with AI
Get the answers you need in no time with our AI-driven, step-by-step assistance
Get Started
Quantum Chemistry
Authors: Ira N. Levine
7th edition
321803450, 978-0321803450