Answered step by step
Verified Expert Solution
Link Copied!

Question

1 Approved Answer

The vapor pressure, P, of a certain liquid was measured at two temperatures, T. The data is shown in the table. T(K) P (kPa) 225
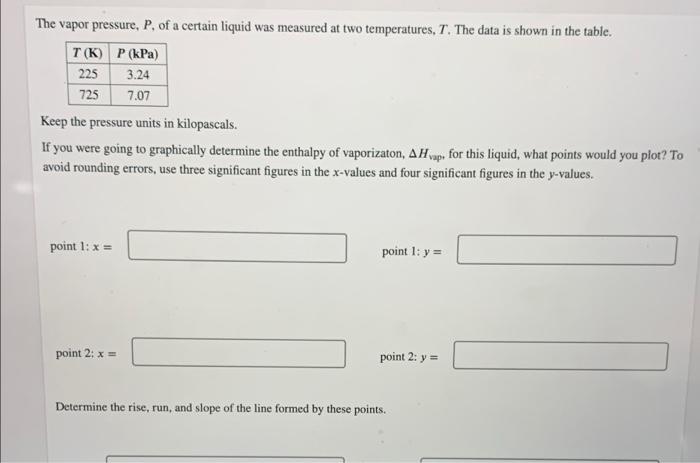
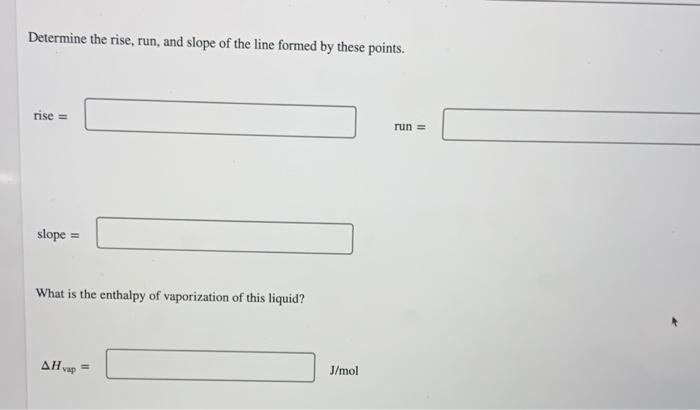
image text in transcribed
The vapor pressure, P, of a certain liquid was measured at two temperatures, T. The data is shown in the table. T(K) P (kPa) 225 3.24 725 7.07 Keep the pressure units in kilopascals. If you were going to graphically determine the enthalpy of vaporizaton, A Hap, for this liquid, what points would you plot? To avoid rounding errors, use three significant figures in the x-values and four significant figures in the y-values. point 1: x = point 1: y = point 2: x = point 2: y = Determine the rise, run, and slope of the line formed by these points. Determine the rise, run, and slope of the line formed by these points. rise = run = slope = What is the enthalpy of vaporization of this liquid? AHvap = J/mol

Step by Step Solution

There are 3 Steps involved in it

Step: 1

blur-text-image

Get Instant Access to Expert-Tailored Solutions

See step-by-step solutions with expert insights and AI powered tools for academic success

Step: 2

blur-text-image_2

Step: 3

blur-text-image_3

Ace Your Homework with AI

Get the answers you need in no time with our AI-driven, step-by-step assistance

Get Started

Recommended Textbook for

Quantitative Chemical Analysis

Authors: Daniel C. Harris, Charles A. Lucy

10th Edition

1319164307, 978-1319164300

More Books

Students also viewed these Chemistry questions

Question

Do I really need this item?

Answered: 1 week ago