

Answered step by step
Verified Expert Solution
Question
1 Approved Answer
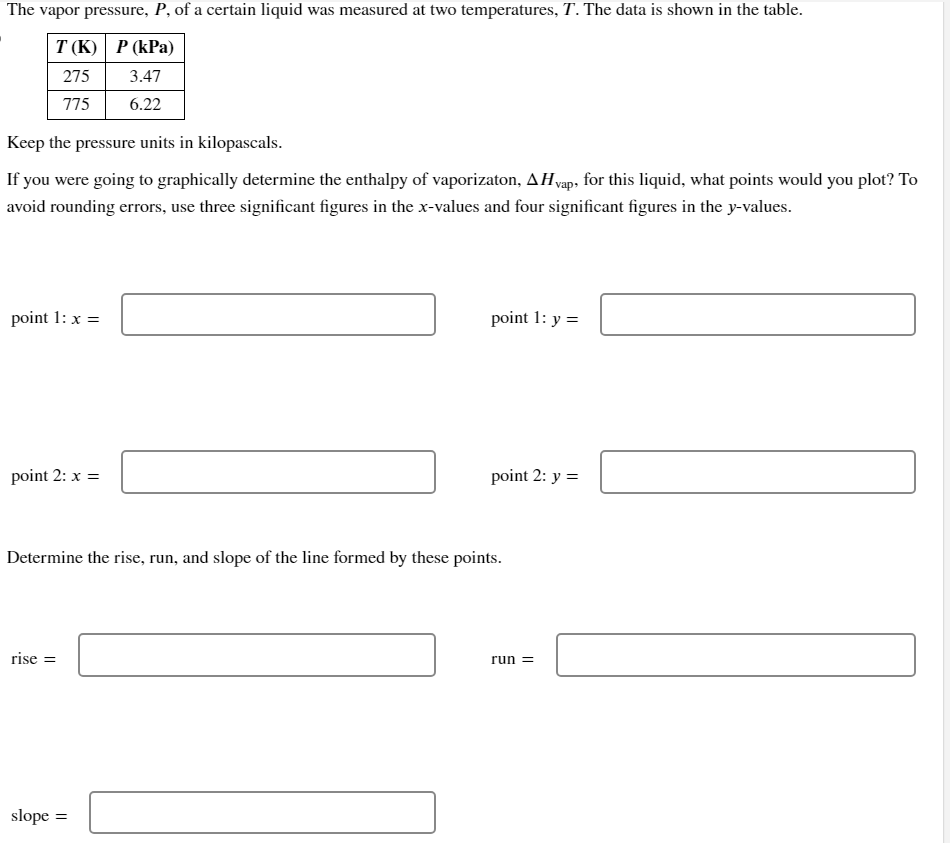
The vapor pressure, P, of a certain liquid was measured at two temperatures, T. The data is shown in the table. Keep the pressure units
Step by Step Solution
There are 3 Steps involved in it
Step: 1

Get Instant Access to Expert-Tailored Solutions
See step-by-step solutions with expert insights and AI powered tools for academic success
Step: 2

Step: 3
Ace Your Homework with AI
Get the answers you need in no time with our AI-driven, step-by-step assistance
Get Started
Modern Chemistry
Authors: RINEHART AND WINSTON HOLT
Student Edition 2007
9780030922046, 0030922046