

Question
The variable sampled is employment income. For the purposes of this assignment, individuals were deleted from the census sample if they were self-employed, their highest
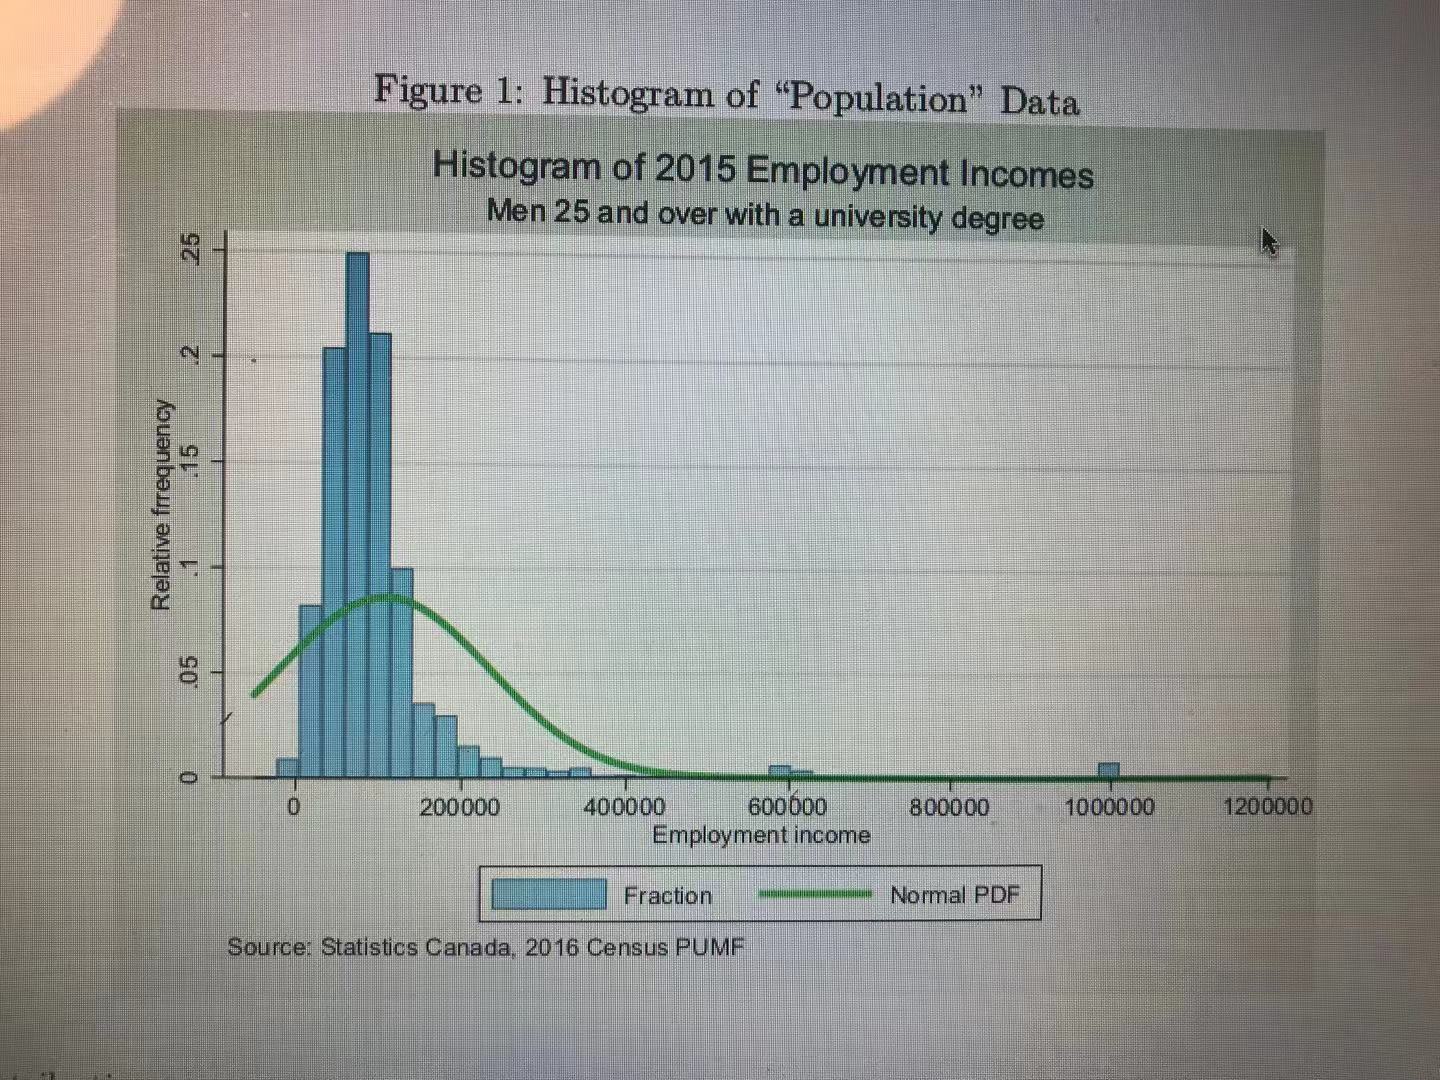
The variable sampled is employment income. For the purposes of this assignment, individuals were deleted from the census sample if they were self-employed, their highest level of education was less than a bachelor's degree, they worked less than 40 weeks full-time during 2015, were under 25, and female. Individuals for whom information about employment income, level of education, age, etc., was missing were also dropped. The starting point for this assignment thus consists of data on the employ- ment incomes of 42,174 university-educated male employees aged 25 and over. This sample will be considered the "population" for the purposes of the assignment. The "population" mean is $107,024.6 and the "population" standard deviation is $125,821.3. The proportion of individuals in the data set with employment income greater than $60,000 is 0.6854. The range of employment incomes in this data set is -$5,000 to $1,200,829. The graph below is a histogram constructed from the 41,174 observations, with relative frequencies plotted on the vertical axis. The green curve that is superimposed on the his- togram shows what a normal probability density function with the same mean and variance as the employment income data would look like. Note that the left-hand tail of the normal distribution is cut off, because the data set does not include any negative incomes.
Step by Step Solution
There are 3 Steps involved in it
Step: 1

Get Instant Access to Expert-Tailored Solutions
See step-by-step solutions with expert insights and AI powered tools for academic success
Step: 2

Step: 3
Ace Your Homework with AI
Get the answers you need in no time with our AI-driven, step-by-step assistance
Get Started
Algebra 1, Grades 9-12
Authors: MCDOUGAL LITTEL
Florida Edition
9780618371839, 0618371834