Answered step by step
Verified Expert Solution
Question
1 Approved Answer
The velocity-time graph represents the motion of an object over a time interval. 30 20 10 i (m/s [N]) 0 1.0 2.0 3.0 4.0 5.0
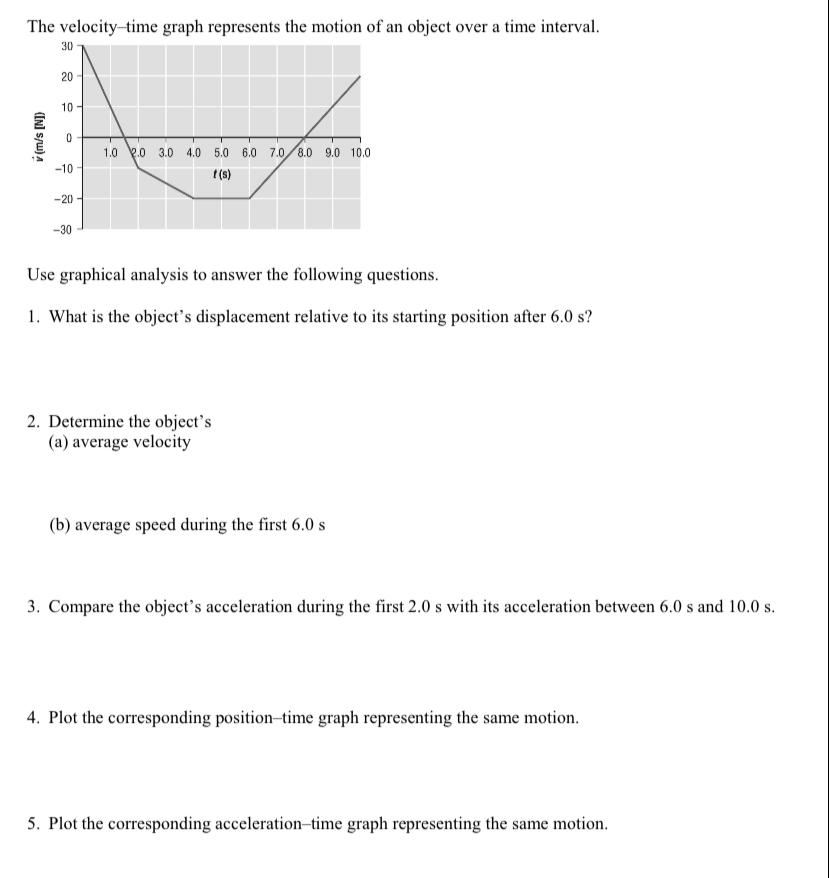
The velocity-time graph represents the motion of an object over a time interval. 30 20 10 i (m/s [N]) 0 1.0 2.0 3.0 4.0 5.0 6.0 7.0 8.0 9.0 10.0 -10 1 (5) -20 -30 Use graphical analysis to answer the following questions. 1. What is the object's displacement relative to its starting position after 6.0 s? 2. Determine the object's (a) average velocity (b) average speed during the first 6.0 s 3. Compare the object's acceleration during the first 2.0 s with its acceleration between 6.0 s and 10.0 s. 4. Plot the corresponding position-time graph representing the same motion. 5. Plot the corresponding acceleration-time graph representing the same motion
Step by Step Solution
There are 3 Steps involved in it
Step: 1
Get Instant Access to Expert-Tailored Solutions
See step-by-step solutions with expert insights and AI powered tools for academic success
Step: 2
Step: 3
Ace Your Homework with AI
Get the answers you need in no time with our AI-driven, step-by-step assistance
Get Started