Question
the visualizewalkingtrajectories.m is load walkingData.mat % create figure and axes figure; trajectory_x_axes = subplot(2, 2, 1); hold on; trajectory_y_axes = subplot(2, 2, 3); hold on;
 the visualizewalkingtrajectories.m is load walkingData.mat % create figure and axes figure; trajectory_x_axes = subplot(2, 2, 1); hold on; trajectory_y_axes = subplot(2, 2, 3); hold on; path_axes = subplot(2, 2, [2 4]); hold on; axis equal; % plot plot(trajectory_x_axes, cop_time, cop_trajectory(:, 1)); plot(trajectory_x_axes, com_time, com_trajectory(:, 1)); plot(trajectory_y_axes, cop_time, cop_trajectory(:, 2)); plot(trajectory_y_axes, com_time, com_trajectory(:, 2)); plot(path_axes, cop_trajectory(:, 1), cop_trajectory(:, 2)); plot(path_axes, com_trajectory(:, 1), com_trajectory(:, 2));I
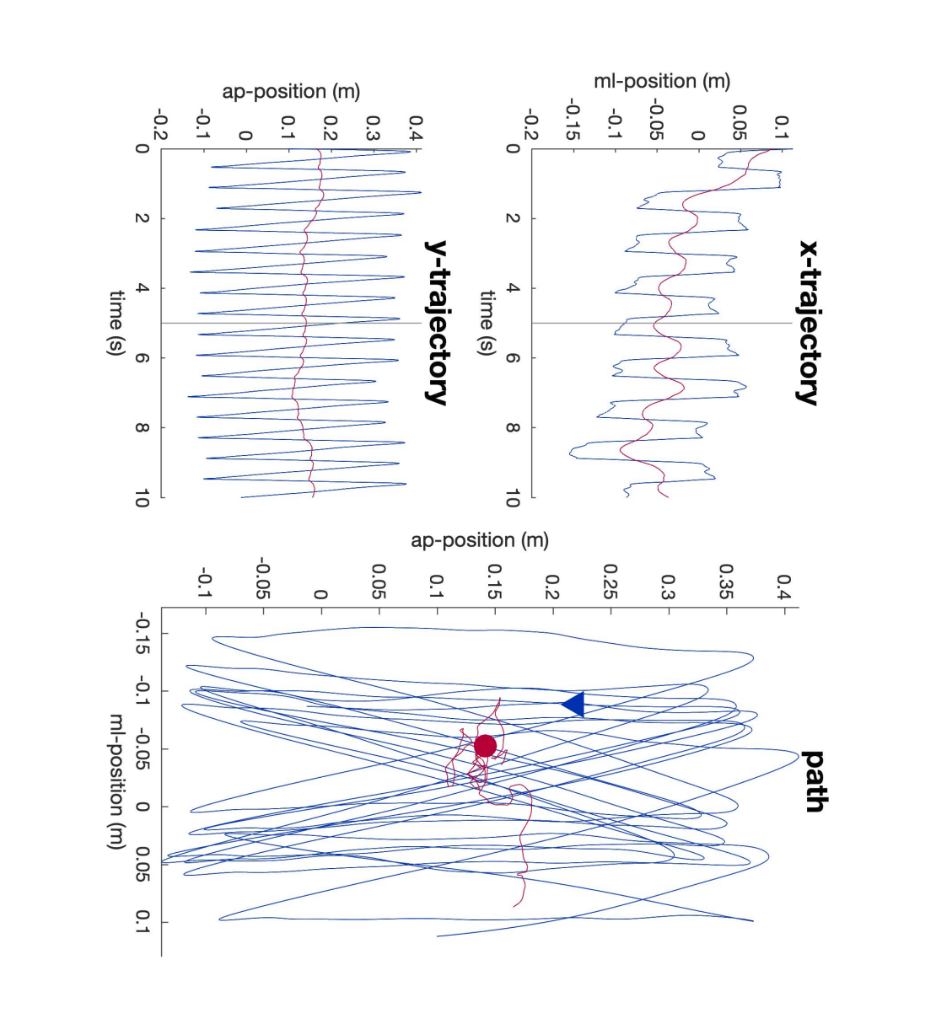
need the labeling of the titles and axis to look like the figure below this but I don't know how to keep them on the different graphs. Everytime i try to add a different title or axis label it erases the previous one.

This is a matlab assignment
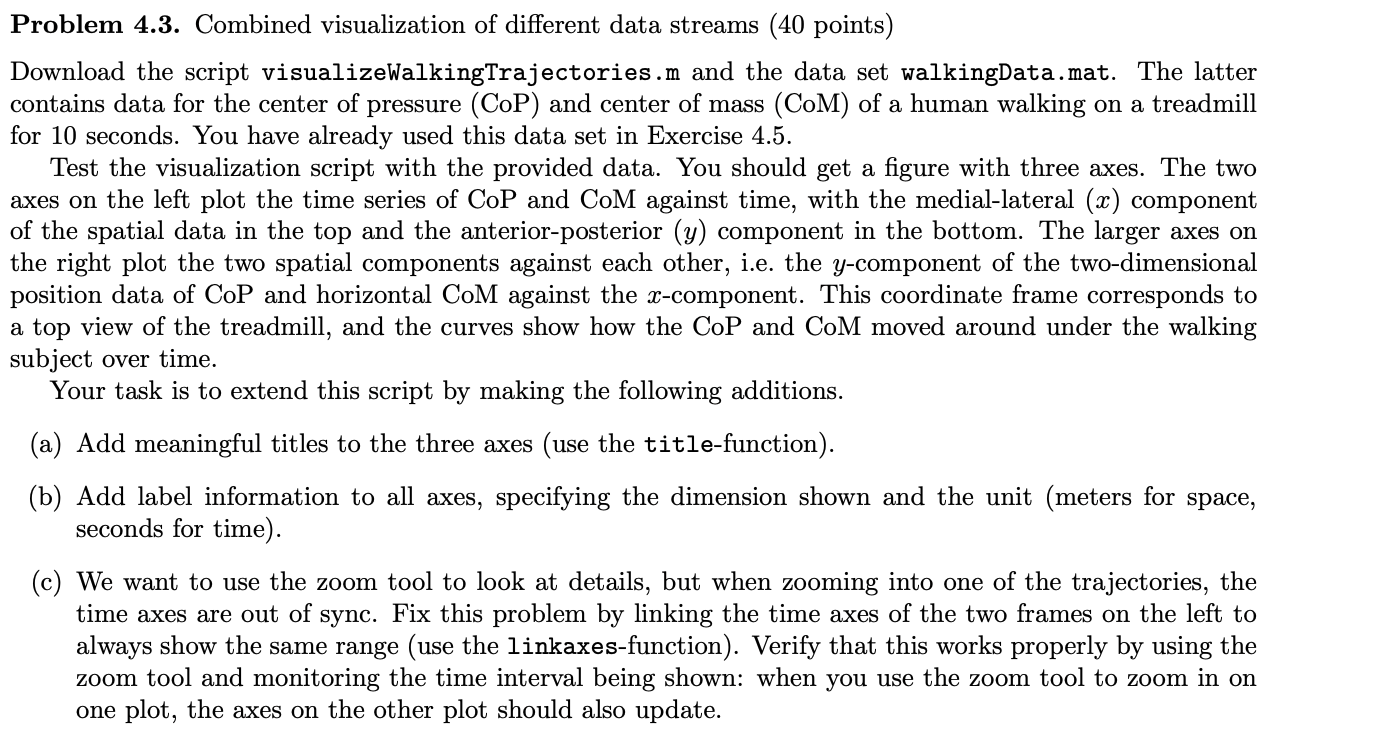
Problem 4.3. Combined visualization of different data streams (40 points) Download the script visualizeWalkingTrajectories.m and the data set walkingData.mat. The latter contains data for the center of pressure (CoP) and center of mass (CoM) of a human walking on a treadmill for 10 seconds. You have already used this data set in Exercise 4.5. Test the visualization script with the provided data. You should get a figure with three axes. The two axes on the left plot the time series of CoP and CoM against time, with the medial-lateral (x) component of the spatial data in the top and the anterior-posterior (y) component in the bottom. The larger axes on the right plot the two spatial components against each other, i.e. the y-component of the two-dimensional position data of CoP and horizontal CoM against the x-component. This coordinate frame corresponds to a top view of the treadmill, and the curves show how the CoP and CoM moved around under the walking subject over time. Your task is to extend this script by making the following additions. (a) Add meaningful titles to the three axes (use the title-function). (b) Add label information to all axes, specifying the dimension shown and the unit (meters for space, seconds for time). (c) We want to use the zoom tool to look at details, but when zooming into one of the trajectories, the time axes are out of sync. Fix this problem by linking the time axes of the two frames on the left to always show the same range (use the linkaxes-function). Verify that this works properly by using the zoom tool and monitoring the time interval being shown: when you use the zoom tool to zoom in on one plot, the axes on the other plot should also update. Problem 4.3. Combined visualization of different data streams (40 points) Download the script visualizeWalkingTrajectories.m and the data set walkingData.mat. The latter contains data for the center of pressure (CoP) and center of mass (CoM) of a human walking on a treadmill for 10 seconds. You have already used this data set in Exercise 4.5. Test the visualization script with the provided data. You should get a figure with three axes. The two axes on the left plot the time series of CoP and CoM against time, with the medial-lateral (x) component of the spatial data in the top and the anterior-posterior (y) component in the bottom. The larger axes on the right plot the two spatial components against each other, i.e. the y-component of the two-dimensional position data of CoP and horizontal CoM against the x-component. This coordinate frame corresponds to a top view of the treadmill, and the curves show how the CoP and CoM moved around under the walking subject over time. Your task is to extend this script by making the following additions. (a) Add meaningful titles to the three axes (use the title-function). (b) Add label information to all axes, specifying the dimension shown and the unit (meters for space, seconds for time). (c) We want to use the zoom tool to look at details, but when zooming into one of the trajectories, the time axes are out of sync. Fix this problem by linking the time axes of the two frames on the left to always show the same range (use the linkaxes-function). Verify that this works properly by using the zoom tool and monitoring the time interval being shown: when you use the zoom tool to zoom in on one plot, the axes on the other plot should also updateStep by Step Solution
There are 3 Steps involved in it
Step: 1

Get Instant Access to Expert-Tailored Solutions
See step-by-step solutions with expert insights and AI powered tools for academic success
Step: 2

Step: 3

Ace Your Homework with AI
Get the answers you need in no time with our AI-driven, step-by-step assistance
Get Started


