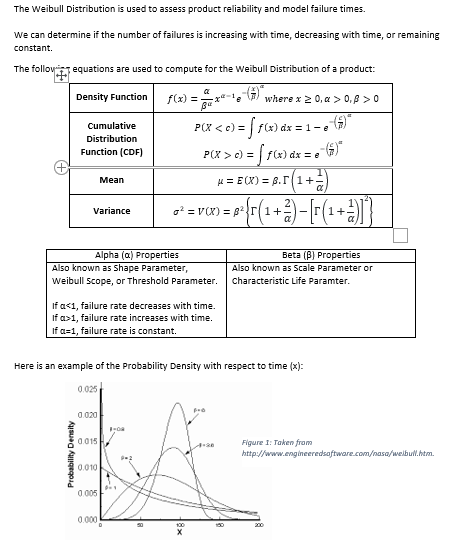


The Weibull Distribution is used to assess product reliability and model failure times. We can determine if the number of failures is increasing with time, decreasing with time, or remaining constant. The follov t.equations are used to compute for the Weibull Distribution of a product: Density Function Cumulative Distribution Function (CDF) f(x) = x ) where x 20,Q> 0,820 P(X
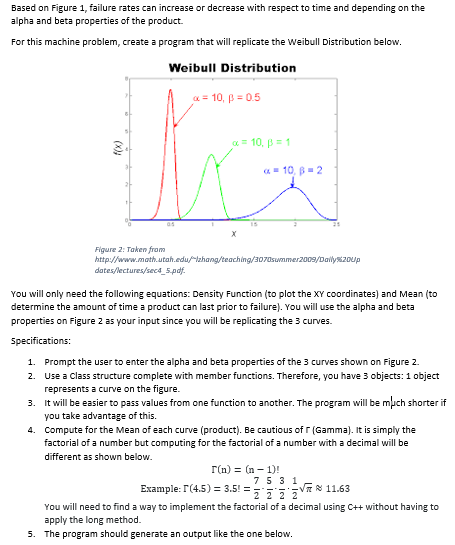
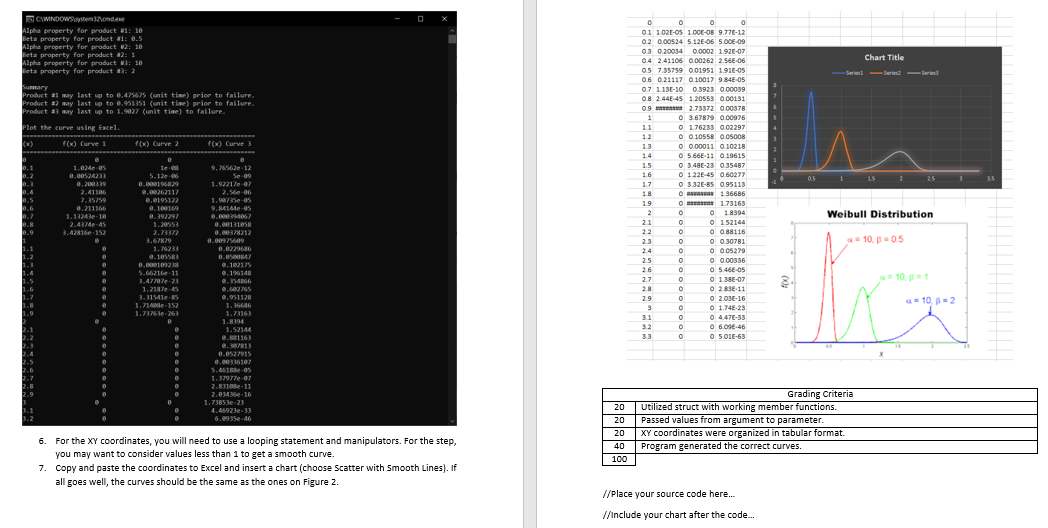
c) = f(x) dx = e Mean u = E(X) = 8.11 Variance o2 = V(X) = 82 r11+ =f={c{1+) [r(1+2))} Alpha (a) Properties Also known as Shape Parameter, Weibull Scope, or Threshold Parameter. Beta () Properties Also known as Scale Parameter or Characteristic Life Paramter. If a1, failure rate increases with time. if a=1, failure rate is constant Here is an example of the Probability Density with respect to time (x): 0.025 0.020 0015 Probability Density Figure 1: Taken from http://www.engineeredsoftware.comasa/webull.htm. 0.010 0.005 0.000 100 Based on Figure 1, failure rates can increase or decrease with respect to time and depending on the alpha and beta properties of the product. For this machine problem, create a program that will replicate the Weibull Distribution below. Weibull Distribution 4 = 10, p = 0.5 f(x) Q = 10, B = 1 - 10,82 Figure 2: Taken from http://www.math.utah.edu/zhang/teaching/3070summer2009/Daily:200p dates/lectures/secd_5.pdf. You will only need the following equations: Density Function (to plot the XY coordinates) and Mean (to determine the amount of time a product can last prior to failure). You will use the alpha and beta properties on Figure 2 as your input since you will be replicating the 3 curves. Specifications: 1. Prompt the user to enter the alpha and beta properties of the 3 curves shown on Figure 2. 2. Use a Class structure complete with member functions. Therefore, you have 3 objects: 1 object represents a curve on the figure. 3. It will be easier to pass values from one function to another. The program will be much shorter if you take advantage of this. 4. Compute for the Mean of each curve (product). Be cautious of r (Gamma). It is simply the factorial of a number but computing for the factorial of a number with a decimal will be different as shown below. r(n) = (n-1)! 7531 Example:T(45) = 3.5 = 2 2 2 2 VT 11.63 You will need to find a way to implement the factorial of a decimal using C++ without having to apply the long method. 5. The program should generate an output like the one below. CYWINDOWSstemondes Alphe property for product wit 10 Beta property for product 11: 8.5 Alphe property for product 2110 Reta property for product 12: 1 Alpha property for product 2: 10 leta property for product 2 Chart Title Summary Product 31 may last up to 6.475675 (unit time) prior to failure Product 22 may last up to 0.951351 (unit time) prior to failure Product 33 way last up to 1.9027 (unit time) to failure. Plot the curve using Excel f(x) Curve 1 f(x) Curve 2 *: F(x) Curve 3 1.02-05 0.00524211 0.0039 2.41106 7.35759 9.211366 1.13.243.10 2.437445 3.42816-152 115 0 0 0 0 0.1 1.02E-OS 1.00E-08 9.77E-12 02 0.00524 5.12E-06 5.00E-09 0.3 0.20034 0.0002 1.92E-07 0.4 2.41106 0.00262 2.56E-06 0.5 7.35759 0.01951 1910-05 06 0.21117 0.10017 9.84E-05 07 113E-10 0.1923 0.00089 0.8 2.44-45 1.20553 0.00131 0.9 mm 2.73372 0.00378 1 0 3.67879 0 00976 11 0 1.76233 0.02297 0 0.10558 005008 0 0.00011 0.10218 0566E-11 0 19615 15 0 3.48E-23 035487 16 0 122E-45 060277 17 0332E-85 0.95113 18 O 136686 19 O 173165 2 018394 21 0152144 22 O 0 0.88116 2.3 O 030781 2.4 0 0 0 05279 25 0 0.00336 26 0 0 5.46E-05 - O 0 1.38E-07 28 0 0 2.83E-11 29 02.03E-16 3 O 0 1.74E-23 O 0 4.47E-33 32 O 0 06.0E 40 0 0 05.01E-63 Weibull Distribution 5.12. 0.0168120 1.000262117 0.0195122 0.100100 4.392297 1.29553 2.73372 3.67879 1.76233 0.105583 0.00010923 5.66216 11 3.470/e-21 1.2187.45 3.31541-55 1.7140-152 1.73763263 0.8 9.765620-12 5e-29 1.92217-22 2.4.06 1.90735-es 9.841418.es 0.000 0394067 0.0013105 0.00378212 0.00975609 0.6229686 0.0047 0.162175 0.196148 8.354366 0.62765 9.951128 1.366.36 1.73163 1.8994 1.52144 2.881163 0.6527915 0.00336197 5.46.188- 1.37977-07 2.83100 11 2.034 Me-16 1.73853e-23 4.65923e-33 6.6935e-46 10-0.5 = 10.5 = 2 0.327813 Grading Criteria 20 Utilized struct with working member functions. 20 Passed values from argument to parameter. 20 XY coordinates were organized in tabular format. 40 Program generated the correct curves. 100 6 6. For the XY coordinates, you will need to use a looping statement and manipulators. For the step, you may want to consider values less than 1 to get a smooth curve. 7. Copy and paste the coordinates to Excel and insert a chart (choose Scatter with Smooth Lines). If all goes well, the curves should be the same as the ones on Figure 2. //Place your source code here... //include your chart after the code


