

Answered step by step
Verified Expert Solution
Question
1 Approved Answer
The weighted Risk Free and Weighted Long Term Portfolio is: WRF (risk free) WLTP (long term portfolio) 100% 0% 90% 10% 80% 20% 70% 30%
The weighted Risk Free and Weighted Long Term Portfolio is:
| WRF (risk free) | WLTP (long term portfolio) |
| 100% | 0% |
| 90% | 10% |
| 80% | 20% |
| 70% | 30% |
| 60% | 40% |
| 50% | 50% |
| 40% | 60% |
| 30% | 70% |
| 20% | 80% |
| 10% | 90% |
| 0% | 100% |
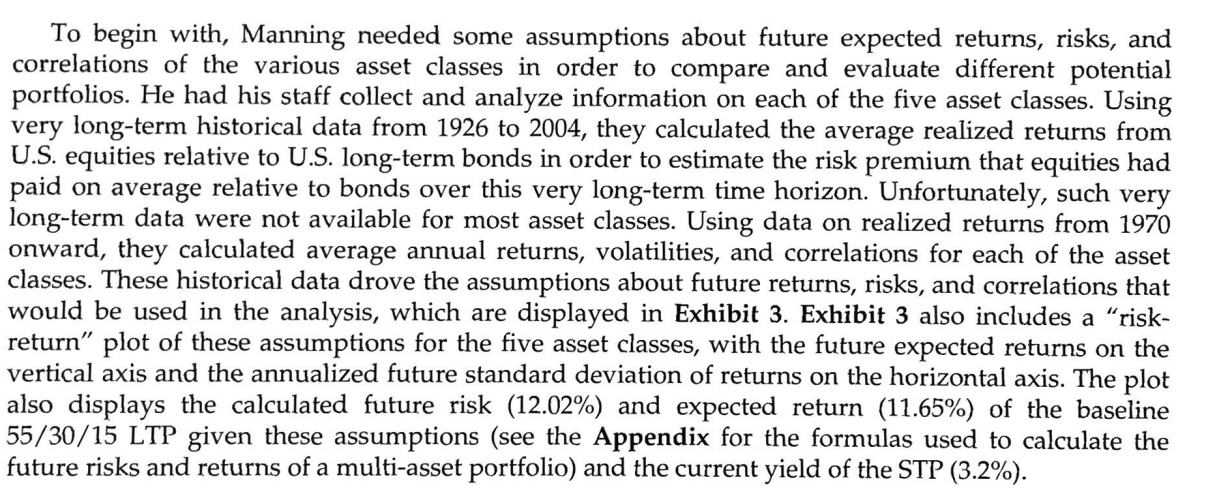
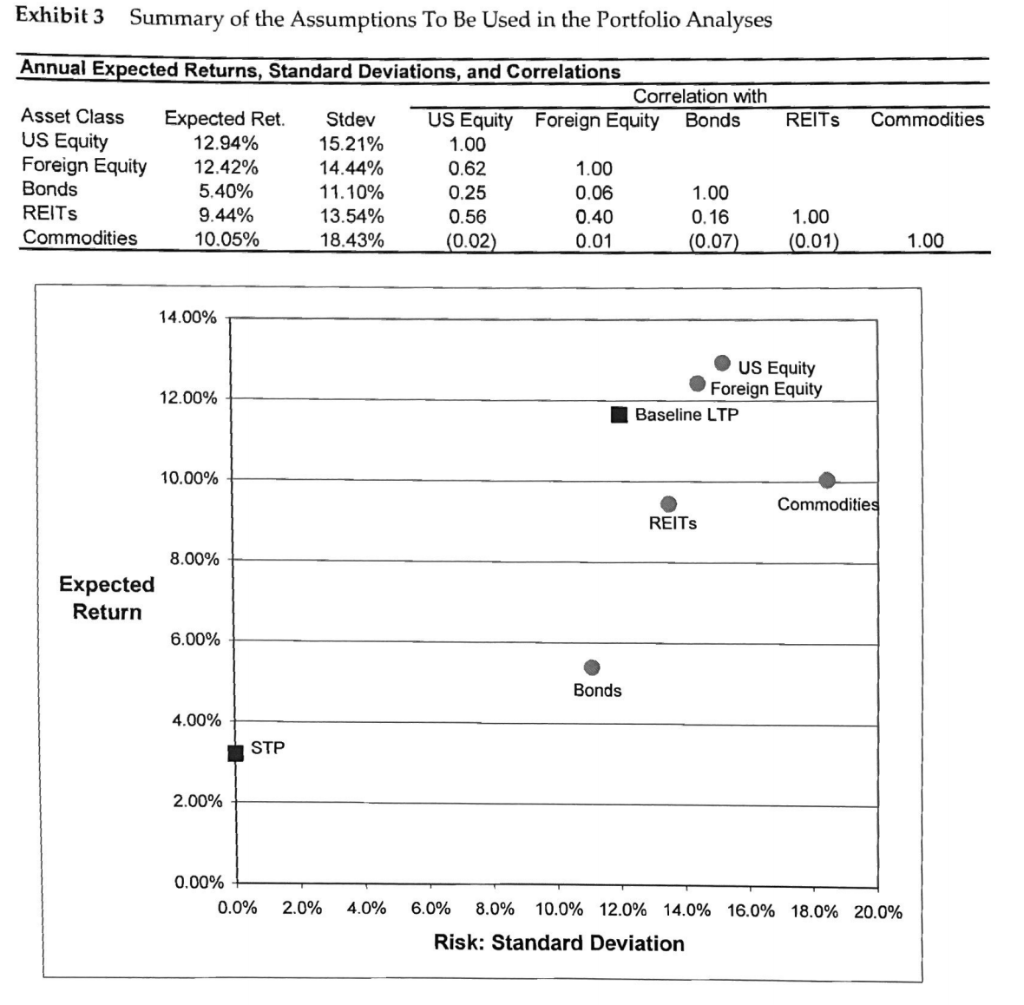
1. Suppose different hospitals within the Partners system choose different mixes of the risk-free STP and the baseline LTP, whose future expected returns and risks are shown in Exhibit 3. On Exhibit 3, plot the returns and risks of the various potential portfolios that can be formed by allocating funds between the STP and the baseline LTP. What shape does a line drawn through these portfolios take? Why? To begin with, Manning needed some assumptions about future expected returns, risks, and correlations of the various asset classes in order to compare and evaluate different potential portfolios. He had his staff collect and analyze information on each of the five asset classes. Using very long-term historical data from 1926 to 2004, they calculated the average realized returns from U.S. equities relative to U.S. long-term bonds in order to estimate the risk premium that equities had paid on average relative to bonds over this very long-term time horizon. Unfortunately, such very long-term data were not available for most asset classes. Using data on realized returns from 1970 onward, they calculated average annual returns, volatilities, and correlations for each of the asset classes. These historical data drove the assumptions about future returns, risks, and correlations that would be used in the analysis, which are displayed in Exhibit 3. Exhibit 3 also includes a "risk- return plot of these assumptions for the five asset classes, with the future expected returns on the vertical axis and the annualized future standard deviation of returns on the horizontal axis. The plot also displays the calculated future risk (12.02%) and expected return (11.65%) of the baseline 55/30/15 LTP given these assumptions (see the Appendix for the formulas used to calculate the future risks and returns of a multi-asset portfolio) and the current yield of the STP (3.2%). Exhibit 3 Summary of the Assumptions To Be Used in the Portfolio Analyses REITS Commodities Annual Expected Returns, Standard Deviations, and Correlations Correlation with Asset Class Expected Ret. Stdev US Equity Foreign Equity Bonds US Equity 12.94% 15.21% 1.00 Foreign Equity 12.42% 14.44% 0.62 1.00 Bonds 5.40% 11.10% 0.25 0.06 1.00 REITS 9.44% 13.54% 0.56 0.40 0.16 Commodities 10.05% 18.43% (0.02) 0.01 (0.07) 1.00 (0.01) 1.00 14.00% 12.00% US Equity Foreign Equity Baseline LTP 10.00% Commodities REITS 8.00% Expected Return 6.00% Bonds 4.00% STP 2.00% 0.00% 0.0% 2.0% 4.0% 6.0% 8.0% 10.0% 12.0% 14.0% 16.0% 18.0% 20.0% Risk: Standard Deviation 1. Suppose different hospitals within the Partners system choose different mixes of the risk-free STP and the baseline LTP, whose future expected returns and risks are shown in Exhibit 3. On Exhibit 3, plot the returns and risks of the various potential portfolios that can be formed by allocating funds between the STP and the baseline LTP. What shape does a line drawn through these portfolios take? Why? To begin with, Manning needed some assumptions about future expected returns, risks, and correlations of the various asset classes in order to compare and evaluate different potential portfolios. He had his staff collect and analyze information on each of the five asset classes. Using very long-term historical data from 1926 to 2004, they calculated the average realized returns from U.S. equities relative to U.S. long-term bonds in order to estimate the risk premium that equities had paid on average relative to bonds over this very long-term time horizon. Unfortunately, such very long-term data were not available for most asset classes. Using data on realized returns from 1970 onward, they calculated average annual returns, volatilities, and correlations for each of the asset classes. These historical data drove the assumptions about future returns, risks, and correlations that would be used in the analysis, which are displayed in Exhibit 3. Exhibit 3 also includes a "risk- return plot of these assumptions for the five asset classes, with the future expected returns on the vertical axis and the annualized future standard deviation of returns on the horizontal axis. The plot also displays the calculated future risk (12.02%) and expected return (11.65%) of the baseline 55/30/15 LTP given these assumptions (see the Appendix for the formulas used to calculate the future risks and returns of a multi-asset portfolio) and the current yield of the STP (3.2%). Exhibit 3 Summary of the Assumptions To Be Used in the Portfolio Analyses REITS Commodities Annual Expected Returns, Standard Deviations, and Correlations Correlation with Asset Class Expected Ret. Stdev US Equity Foreign Equity Bonds US Equity 12.94% 15.21% 1.00 Foreign Equity 12.42% 14.44% 0.62 1.00 Bonds 5.40% 11.10% 0.25 0.06 1.00 REITS 9.44% 13.54% 0.56 0.40 0.16 Commodities 10.05% 18.43% (0.02) 0.01 (0.07) 1.00 (0.01) 1.00 14.00% 12.00% US Equity Foreign Equity Baseline LTP 10.00% Commodities REITS 8.00% Expected Return 6.00% Bonds 4.00% STP 2.00% 0.00% 0.0% 2.0% 4.0% 6.0% 8.0% 10.0% 12.0% 14.0% 16.0% 18.0% 20.0% Risk: Standard Deviation
Step by Step Solution
There are 3 Steps involved in it
Step: 1

Get Instant Access to Expert-Tailored Solutions
See step-by-step solutions with expert insights and AI powered tools for academic success
Step: 2

Step: 3
Ace Your Homework with AI
Get the answers you need in no time with our AI-driven, step-by-step assistance
Get Started
Cryptoassets The Innovative Investors Guide To Bitcoin And Beyond
Authors: Chris Burniske ,Jack Tatar
1st Edition
1260026671, 126002668X, 9781260026672, 9781260026689