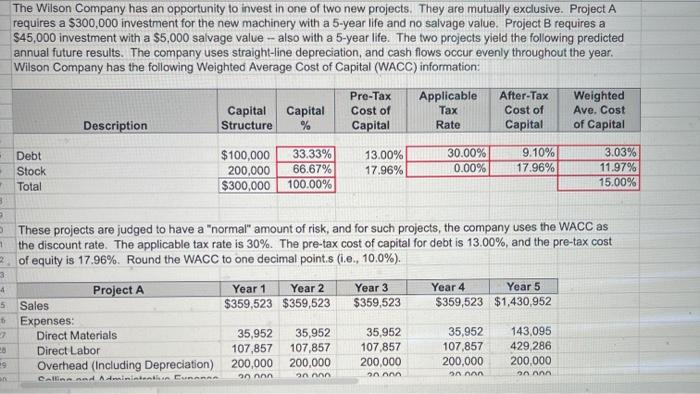
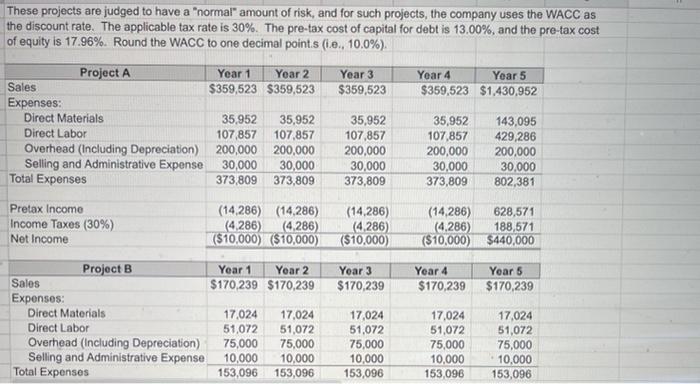
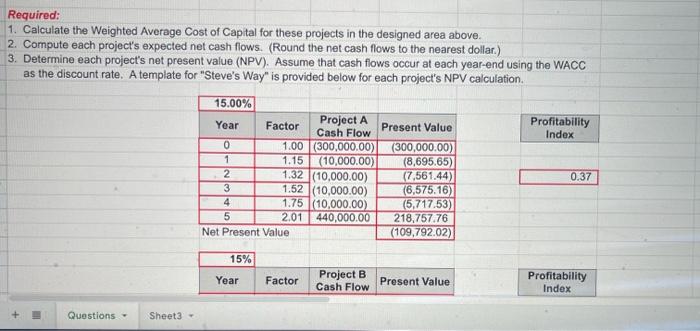
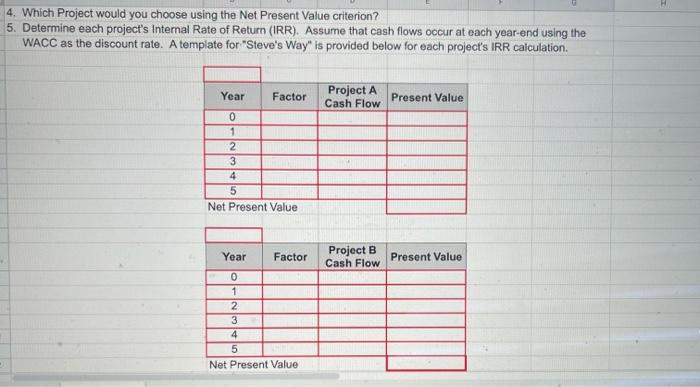
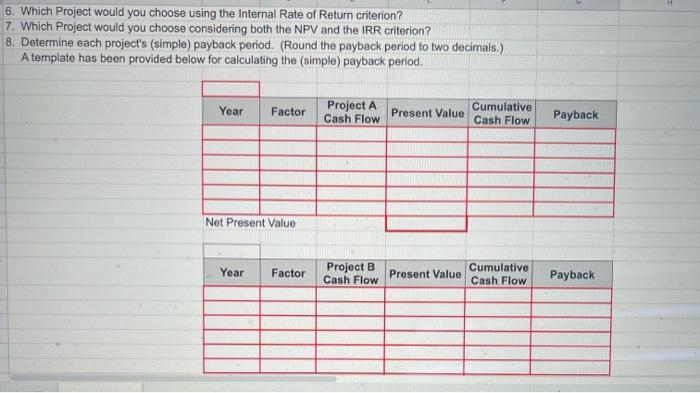
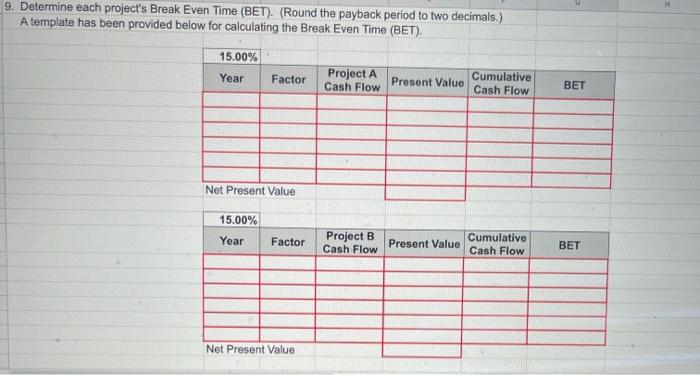
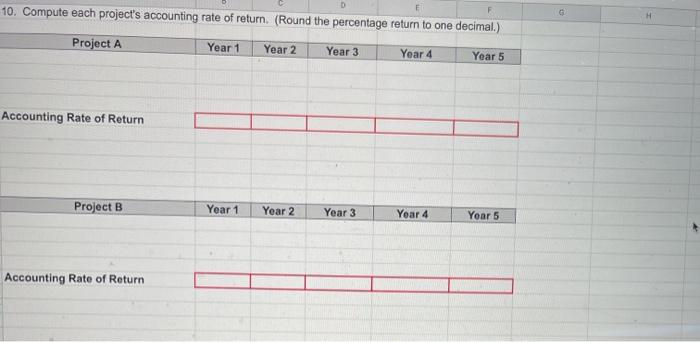
The Wilson Company has an opportunity to invest in one of two new projects. They are mutually exclusive. Project A requires a $300,000 investment for the new machinery with a 5-year life and no salvage value. Project B requires a S45,000 investment with a $5,000 salvage value -- also with a 5-year life. The two projects yield the following predicted annual future results. The company uses straight-line depreciation, and cash flows occur evenly throughout the year. Wilson Company has the following Weighted Average Cost of Capital (WACC) information: Pre-Tax Applicable After-Tax Weighted Capital Capital Cost of Tax Cost of Ave. Cost Description Structure % Capital Rate Capital of Capital Debt Stock Total $100,000 33.33% 200,000 66.67% $300,000 100.00% 13.00% 17.96% 30.00% 0.00% 9.10% 17.96% 3.03% 11.97% 15.00% These projects are judged to have a "normal" amount of risk, and for such projects, the company uses the WACC as the discount rate. The applicable tax rate is 30%. The pre-tax cost of capital for debt is 13.00%, and the pre-tax cost of equity is 17.96%. Round the WACC to one decimal points (ie., 10.0%). 1 2 3 4 5 Year 3 $359,523 Year 4 Year 5 $359,523 $1,430,952 2 Project A Year 1 Year 2 Sales $359,523 $359,523 Expenses: Direct Materials 35,952 35,952 Direct Labor 107,857 107,857 Overhead (Including Depreciation) 200,000 200,000 Callind Admini CURARAR Onn onnan 35,952 107,857 200,000 000 35,952 107,857 200,000 nan 143,095 429 286 200,000 O A 9 These projects are judged to have a "normal" amount of risk, and for such projects, the company uses the WACC as the discount rate. The applicable tax rate is 30%. The pre-tax cost of capital for debt is 13.00%, and the pre-tax cost of equity is 17.96%. Round the WACC to one decimal points (i.e., 10.0%). Project A Year 1 Year 2 Year 3 Year 4 Year 5 Sales $359,523 $359,523 $359,523 $359,523 $1.430,952 Expenses: Direct Materials 35,952 35,952 35,952 35,952 143,095 Direct Labor 107,857 107,857 107,857 107,857 429,286 Overhead (Including Depreciation) 200,000 200,000 200,000 200,000 200,000 Selling and Administrative Expense 30,000 30,000 30,000 30,000 30,000 Total Expenses 373,809 373,809 373,809 373,809 802,381 Pretax income Income Taxes (30%) Net Income (14,286) (14,286) (4.286) (4,286) ($10,000) ($10,000) (14,286) (4.286) ($10,000) (14,286) 628,571 (4.286) 188,571 ($10,000) $440,000 Year 1 Year 2 $170,239 $170,239 Year 3 $170,239 Year 4 Year 5 $170,239 $170,239 Project B Sales Expenses: Direct Materials Direct Labor Overhead (Including Depreciation) Selling and Administrative Expense Total Expenses 17,024 51,072 75,000 10,000 153,096 17,024 51,072 75,000 10,000 153,096 17,024 51,072 75,000 10,000 153,096 17,024 51,072 75,000 10,000 153,096 17,024 51,072 75,000 10,000 153,096 Required: 1. Calculate the Weighted Average Cost of Capital for these projects in the designed area above. 2. Compute each project's expected net cash flows. (Round the net cash flows to the nearest dollar.) 3. Determine each project's net present value (NPV). Assume that cash flows occur at each year-end using the WACC as the discount rate. A template for "Steve's Way" is provided below for each project's NPV calculation. Profitability Index 15.00% Year Factor Project A Present Value Cash Flow 0 1.00 (300,000.00) (300,000.00) 1 1.15 (10,000.00) (8,695.65) 2 1.32 (10,000.00) (7,561.44) 3 1.52 (10,000.00) (6,575.16) 4 1.75 (10,000.00) (5,717.53) 5 2.01 440,000.00 218,757.76 Net Present Value (109,792.02) 0.37 15% Year Factor Project B Cash Flow Present Value Profitability Index Questions - Sheet3 - 4. Which Project would you choose using the Net Present Value criterion? 5. Determine each project's Internal Rate of Return (IRR). Assume that cash flows occur at each year-end using the WACC as the discount rate. A template for "Steve's Way" is provided below for each project's IRR calculation. Project A Cash Flow Present Value Year Factor 0 1 2 3 4 5 Net Present Value Year Factor Project B Cash Flow Present Value 0 1 2 3 4 5 Net Present Value . 6. Which Project would you choose using the Internal Rate of Return criterion? 7. Which Project would you choose considering both the NPV and the IRR criterion? 8. Determine each project's (simple) payback period. (Round the payback period to two decimals.) A template has been provided below for calculating the (simple) payback period. Year Factor Project A Cash Flow Present Value Cumulative Cash Flow Payback Net Present Value Year Factor Project B Cash Flow Present Value Cumulative Cash Flow Payback 9. Determine each project's Break Even Time (BET). (Round the payback period to two decimals.) A template has been provided below for calculating the Break Even Time (BET). 15.00% Year Factor Project A Cash Flow Present Value Cumulative Cash Flow BET Net Present Value 15.00% Year Factor Project B Cash Flow Present Value Cumulative Cash Flow BET Net Present Value 10. Compute each project's accounting rate of return (Round the percentage return to one decimal.) H Project A Year 1 Year 2 Year 3 Year 4 Year 5 Accounting Rate of Return Project B Year 1 Year 2 Year 3 Year 4 Yoar 5 Accounting Rate of Return B C H Analysis Component: 11. Identify the project you would recommend to management and explain your choice. Management does not clearly understand the financial calculations made as part of these project evaluations, so be sure to explain the "meaning of the above calculations as the basis for your recommendation. The project chosen could be different among the groups depending on the weighting your team gives to risk. The Wilson Company has an opportunity to invest in one of two new projects. They are mutually exclusive. Project A requires a $300,000 investment for the new machinery with a 5-year life and no salvage value. Project B requires a S45,000 investment with a $5,000 salvage value -- also with a 5-year life. The two projects yield the following predicted annual future results. The company uses straight-line depreciation, and cash flows occur evenly throughout the year. Wilson Company has the following Weighted Average Cost of Capital (WACC) information: Pre-Tax Applicable After-Tax Weighted Capital Capital Cost of Tax Cost of Ave. Cost Description Structure % Capital Rate Capital of Capital Debt Stock Total $100,000 33.33% 200,000 66.67% $300,000 100.00% 13.00% 17.96% 30.00% 0.00% 9.10% 17.96% 3.03% 11.97% 15.00% These projects are judged to have a "normal" amount of risk, and for such projects, the company uses the WACC as the discount rate. The applicable tax rate is 30%. The pre-tax cost of capital for debt is 13.00%, and the pre-tax cost of equity is 17.96%. Round the WACC to one decimal points (ie., 10.0%). 1 2 3 4 5 Year 3 $359,523 Year 4 Year 5 $359,523 $1,430,952 2 Project A Year 1 Year 2 Sales $359,523 $359,523 Expenses: Direct Materials 35,952 35,952 Direct Labor 107,857 107,857 Overhead (Including Depreciation) 200,000 200,000 Callind Admini CURARAR Onn onnan 35,952 107,857 200,000 000 35,952 107,857 200,000 nan 143,095 429 286 200,000 O A 9 These projects are judged to have a "normal" amount of risk, and for such projects, the company uses the WACC as the discount rate. The applicable tax rate is 30%. The pre-tax cost of capital for debt is 13.00%, and the pre-tax cost of equity is 17.96%. Round the WACC to one decimal points (i.e., 10.0%). Project A Year 1 Year 2 Year 3 Year 4 Year 5 Sales $359,523 $359,523 $359,523 $359,523 $1.430,952 Expenses: Direct Materials 35,952 35,952 35,952 35,952 143,095 Direct Labor 107,857 107,857 107,857 107,857 429,286 Overhead (Including Depreciation) 200,000 200,000 200,000 200,000 200,000 Selling and Administrative Expense 30,000 30,000 30,000 30,000 30,000 Total Expenses 373,809 373,809 373,809 373,809 802,381 Pretax income Income Taxes (30%) Net Income (14,286) (14,286) (4.286) (4,286) ($10,000) ($10,000) (14,286) (4.286) ($10,000) (14,286) 628,571 (4.286) 188,571 ($10,000) $440,000 Year 1 Year 2 $170,239 $170,239 Year 3 $170,239 Year 4 Year 5 $170,239 $170,239 Project B Sales Expenses: Direct Materials Direct Labor Overhead (Including Depreciation) Selling and Administrative Expense Total Expenses 17,024 51,072 75,000 10,000 153,096 17,024 51,072 75,000 10,000 153,096 17,024 51,072 75,000 10,000 153,096 17,024 51,072 75,000 10,000 153,096 17,024 51,072 75,000 10,000 153,096 Required: 1. Calculate the Weighted Average Cost of Capital for these projects in the designed area above. 2. Compute each project's expected net cash flows. (Round the net cash flows to the nearest dollar.) 3. Determine each project's net present value (NPV). Assume that cash flows occur at each year-end using the WACC as the discount rate. A template for "Steve's Way" is provided below for each project's NPV calculation. Profitability Index 15.00% Year Factor Project A Present Value Cash Flow 0 1.00 (300,000.00) (300,000.00) 1 1.15 (10,000.00) (8,695.65) 2 1.32 (10,000.00) (7,561.44) 3 1.52 (10,000.00) (6,575.16) 4 1.75 (10,000.00) (5,717.53) 5 2.01 440,000.00 218,757.76 Net Present Value (109,792.02) 0.37 15% Year Factor Project B Cash Flow Present Value Profitability Index Questions - Sheet3 - 4. Which Project would you choose using the Net Present Value criterion? 5. Determine each project's Internal Rate of Return (IRR). Assume that cash flows occur at each year-end using the WACC as the discount rate. A template for "Steve's Way" is provided below for each project's IRR calculation. Project A Cash Flow Present Value Year Factor 0 1 2 3 4 5 Net Present Value Year Factor Project B Cash Flow Present Value 0 1 2 3 4 5 Net Present Value . 6. Which Project would you choose using the Internal Rate of Return criterion? 7. Which Project would you choose considering both the NPV and the IRR criterion? 8. Determine each project's (simple) payback period. (Round the payback period to two decimals.) A template has been provided below for calculating the (simple) payback period. Year Factor Project A Cash Flow Present Value Cumulative Cash Flow Payback Net Present Value Year Factor Project B Cash Flow Present Value Cumulative Cash Flow Payback 9. Determine each project's Break Even Time (BET). (Round the payback period to two decimals.) A template has been provided below for calculating the Break Even Time (BET). 15.00% Year Factor Project A Cash Flow Present Value Cumulative Cash Flow BET Net Present Value 15.00% Year Factor Project B Cash Flow Present Value Cumulative Cash Flow BET Net Present Value 10. Compute each project's accounting rate of return (Round the percentage return to one decimal.) H Project A Year 1 Year 2 Year 3 Year 4 Year 5 Accounting Rate of Return Project B Year 1 Year 2 Year 3 Year 4 Yoar 5 Accounting Rate of Return B C H Analysis Component: 11. Identify the project you would recommend to management and explain your choice. Management does not clearly understand the financial calculations made as part of these project evaluations, so be sure to explain the "meaning of the above calculations as the basis for your recommendation. The project chosen could be different among the groups depending on the weighting your team gives to risk
