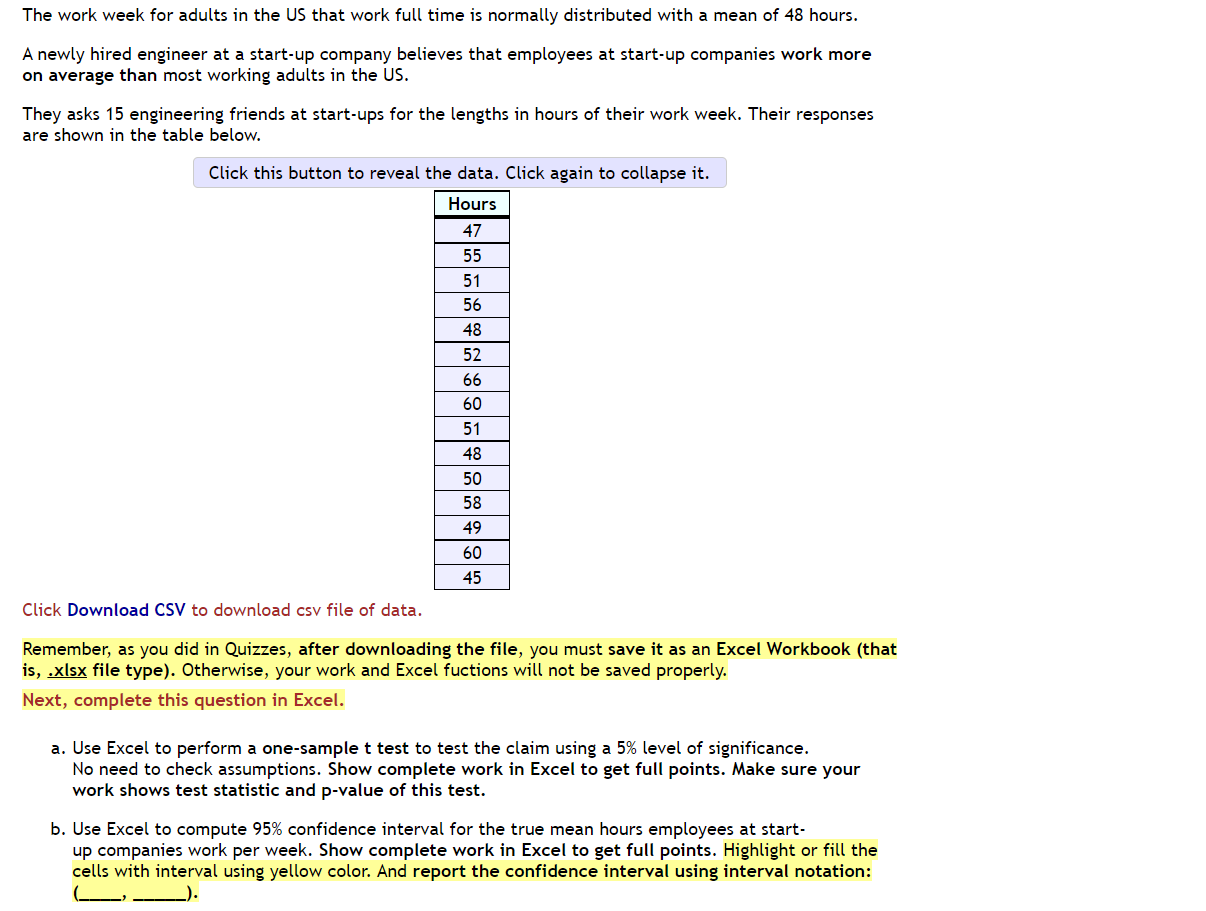
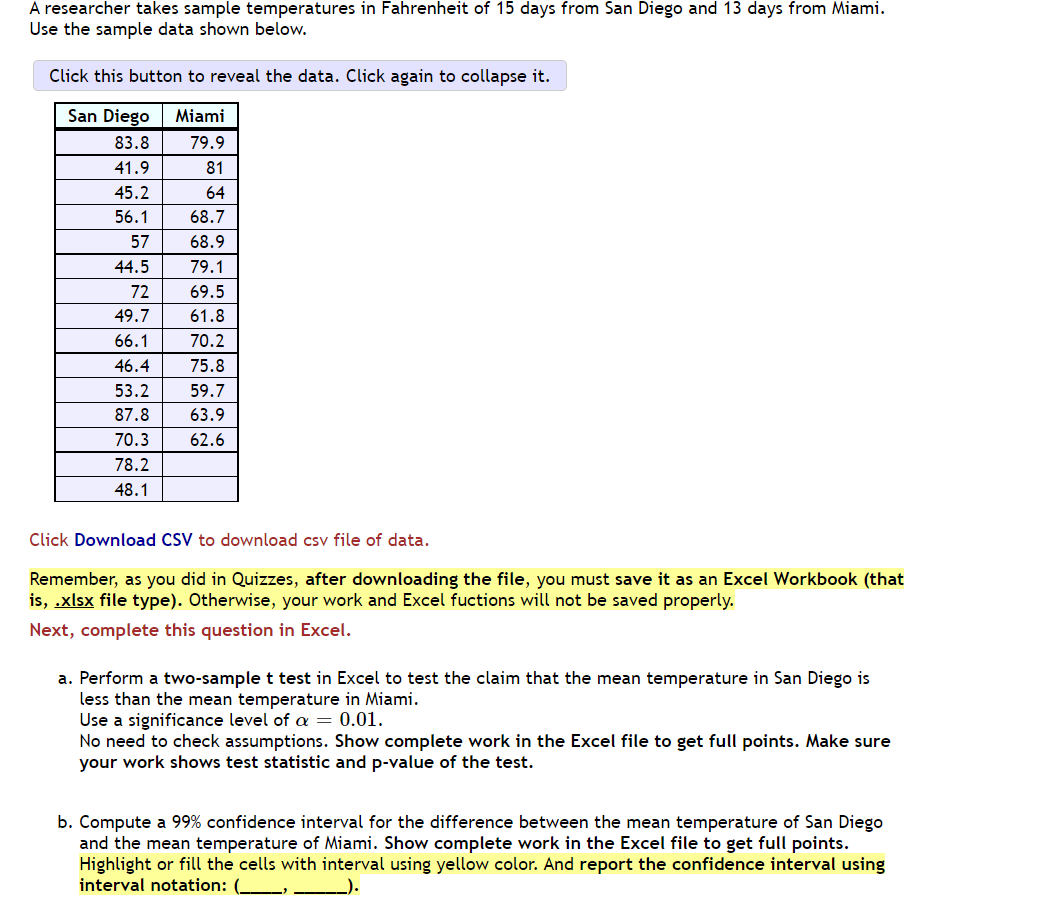
The work week for adults in the US that work full time is normally distributed with a mean of 48 hours. A newly hired engineer at a start-up company believes that employees at start-up companies work more on average than most working adults in the US. They asks 15 engineering friends at start-ups for the lengths in hours of their work week. Their responses are shown in the table below. Click this button to reveal the data. Click again to collapse it. Hours 47 55 51 56 48 52 66 60 51 48 50 58 Click Download CSV to download csv file of data. Remember, as you did in Quizzes, after downloading the file, you must save it as an Excel Workbook (that is, .xlsx file type). Otherwise, your work and Excel fuctions will not be saved properly. Next, complete this question in Excel. a. Use Excel to perform a one-sample t test to test the claim using a 5% level of significance. No need to check assumptions. Show complete work in Excel to get full points. Make sure your work shows test statistic and p-value of this test. b. Use Excel to compute 95% confidence interval for the true mean hours employees at start- up companies work per week. Show complete work in Excel to get full points. Highlight or fill the cells with interval using yellow color. And report the confidence interval using interval notation: *** A researcher takes sample temperatures in Fahrenheit of 15 days from San Diego and 13 days from Miami. Use the sample data shown below. Click this button to reveal the data. Click again to collapse it. San Diego Miami 83.8 79.9 41.9 81 45.2 64 56.1 68.7 57 68.9 44.5 79.1 69.5 72 49.7 61.8 66.1 70.2 46.4 75.8 53.2 59.7 87.8 63.9 70.3 62.6 78.2 48.1 Click Download CSV to download csv file of data. Remember, as you did in Quizzes, after downloading the file, you must save it as an Excel Workbook (that is, .xlsx file type). Otherwise, your work and Excel fuctions will not be saved properly. Next, complete this question in Excel. a. Perform a two-sample t test in Excel to test the claim that the mean temperature in San Diego is less than the mean temperature in Miami. Use a significance level of a = 0.01. No need to check assumptions. Show complete work in the Excel file to get full points. Make sure your work shows test statistic and p-value of the test. b. Compute a 99% confidence interval for the difference between the mean temperature of San Diego and the mean temperature of Miami. Show complete work in the Excel file to get full points. Highlight or fill the cells with interval using yellow color. And report the confidence interval using interval notation: (___________, The work week for adults in the US that work full time is normally distributed with a mean of 48 hours. A newly hired engineer at a start-up company believes that employees at start-up companies work more on average than most working adults in the US. They asks 15 engineering friends at start-ups for the lengths in hours of their work week. Their responses are shown in the table below. Click this button to reveal the data. Click again to collapse it. Hours 47 55 51 56 48 52 66 60 51 48 50 58 Click Download CSV to download csv file of data. Remember, as you did in Quizzes, after downloading the file, you must save it as an Excel Workbook (that is, .xlsx file type). Otherwise, your work and Excel fuctions will not be saved properly. Next, complete this question in Excel. a. Use Excel to perform a one-sample t test to test the claim using a 5% level of significance. No need to check assumptions. Show complete work in Excel to get full points. Make sure your work shows test statistic and p-value of this test. b. Use Excel to compute 95% confidence interval for the true mean hours employees at start- up companies work per week. Show complete work in Excel to get full points. Highlight or fill the cells with interval using yellow color. And report the confidence interval using interval notation: *** A researcher takes sample temperatures in Fahrenheit of 15 days from San Diego and 13 days from Miami. Use the sample data shown below. Click this button to reveal the data. Click again to collapse it. San Diego Miami 83.8 79.9 41.9 81 45.2 64 56.1 68.7 57 68.9 44.5 79.1 69.5 72 49.7 61.8 66.1 70.2 46.4 75.8 53.2 59.7 87.8 63.9 70.3 62.6 78.2 48.1 Click Download CSV to download csv file of data. Remember, as you did in Quizzes, after downloading the file, you must save it as an Excel Workbook (that is, .xlsx file type). Otherwise, your work and Excel fuctions will not be saved properly. Next, complete this question in Excel. a. Perform a two-sample t test in Excel to test the claim that the mean temperature in San Diego is less than the mean temperature in Miami. Use a significance level of a = 0.01. No need to check assumptions. Show complete work in the Excel file to get full points. Make sure your work shows test statistic and p-value of the test. b. Compute a 99% confidence interval for the difference between the mean temperature of San Diego and the mean temperature of Miami. Show complete work in the Excel file to get full points. Highlight or fill the cells with interval using yellow color. And report the confidence interval using interval notation: (___________