The World Investment Report published annually by UNCTAD provides a summary of recent trends in FDI as well as quick access to comprehensive investment statistics. The ranking is based on the foreign assets each corporation owns. Based only on the top 20 companies, provide a summary of the countries and industries represented. Do you notice any common traits from your analysis? Did any industries or countries in the top 20 surprise you? Why?
The report is as follows:
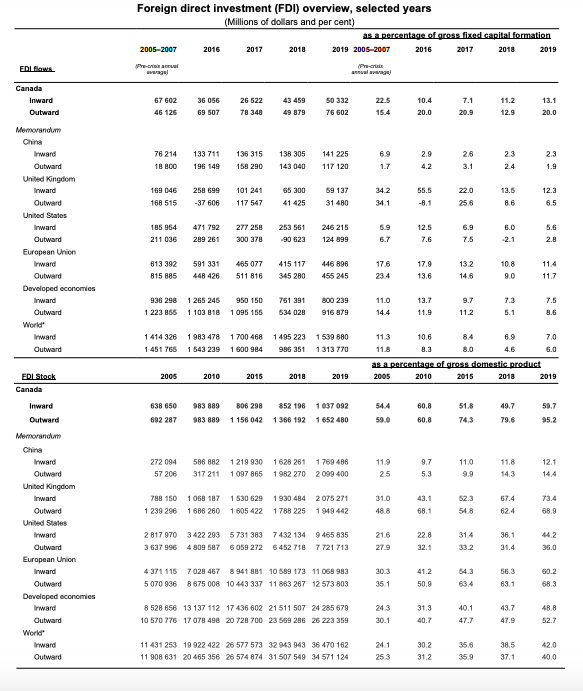
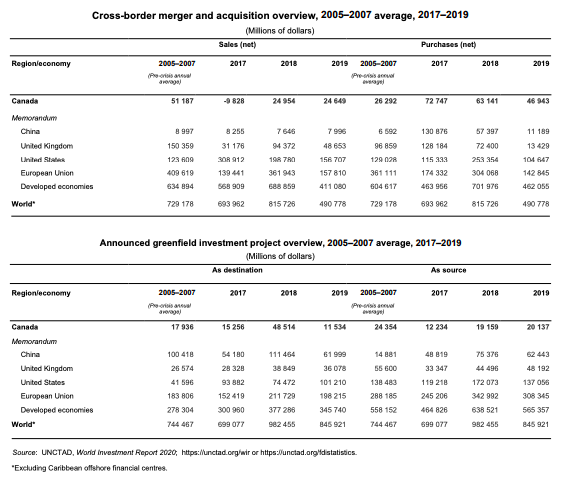
Foreign direct investment (FDI) overview, selected years (Millions of dollars and per cent) as a percentage of gross fixed capital formation 2005-2007 2016 2017 2018 2019 2005-2007 2016 2017 2018 2019 EDIflows Canada Inward Outward 22.5 7.1 13.1 67 602 46 126 36 066 69 507 26 522 78 348 43 459 49 879 50 332 76 602 10.4 20.0 11.2 12.9 15.4 20.0 6.9 2.6 76 214 18 800 133 711 196 149 136 315 158 290 138 305 143 040 141 225 117 120 2.9 4.2 2.3 2.4 2.3 1.9 1.7 3.1 169 046 168 515 258 699 -37 606 101 241 117 547 65 300 41 425 59137 31 480 342 34.1 55.5 -8.1 22.0 25.6 13.5 8.6 12.3 6.5 Memorandum China Inward Outward United Kingdom Inward Outward United States Inward Outward European Union Inward Outward Developed economies Inward Outward World Inward Outward 185 964 211 036 471 792 289 261 277 258 300 378 253 561 -90 623 246 215 124 899 5.9 6.7 12.5 7.6 6.9 7.5 6.0 -2.1 5.6 2.8 613 392 815 885 591 331 448 426 465 077 511 816 415 117 345 280 446 898 455 245 176 23.4 17.9 13.6 13.2 14,6 10.8 90 11.4 11.7 936 298 1 223 855 1 265 245 1 103 818 950 150 1 095 155 761 391 534 028 800 239 916 879 11.0 14.4 13.7 11.9 9.7 11.2 7.5 8.6 5.1 1 414 326 1 983 478 1 700 468 1 451 765 1 543 239 1 600 984 1 495 223 986 351 1 539 880 1 313770 113 10.6 6.9 7.0 11.8 8.0 4.6 6.0 as a percentage of gross domestic product 2005 2010 2015 2018 2019 2005 2010 2015 2018 2019 638 650 692 287 983 880 983 889 806 298 1 156 042 852 196 1037092 1 366 192 1652 480 544 590 60.8 60.8 51.8 74.3 49.7 79.6 59.7 95.2 272 094 57206 586 882 1219 930 317 211 1 097 865 1 628 261 1 769 486 1 982 270 2099 400 119 25 9.7 5.3 11.0 9.9 11.8 14.3 12.1 144 788 150 1 068 187 1 239 296 1 686 260 1 530 629 1 930 484 2075 271 1 605 422 1788 225 1949 442 31.0 488 43.1 68.1 52.3 548 67.4 62.4 73.4 68.9 EDI Stock Canada Inward Outward Memorandum China Inward Outward United Kingdom Inward Outward United States Inward Outward European Union Inward Outward Developed economies Inward Outward World Inward Outward 2 817 970 3 422 293 5731 383 7432 134 9465 835 3 637 996 4 809 687 6059 272 6452 718 7 721 713 216 27.9 22.8 32.1 314 33.2 36.1 31.4 44.2 36.0 54.3 4 371 115 7028 467 8941 981 10 589 173 11 068 993 5070 936 8675 008 10 443 337 11 863 267 12 573 803 30.3 35.1 41.2 50,9 56.3 63.1 60.2 68.3 243 31.3 40.1 43.7 8 528 656 13 137 112 17 438 602 21 511 507 24 285 679 10 570 776 17078498 20 728 700 23 569 286 25 223 359 48.8 52.7 30.1 40.7 47.0 11 431 253 19 922 422 28 577 573 32 943 943 36 470 162 11 908 631 20 465 356 28 574 874 31 507 549 34 571 124 24.1 253 30.2 31.2 35.6 35.9 38.5 37.1 42.0 400 Cross-border merger and acquisition overview, 2005-2007 average, 2017-2019 (Millions of dollars) Sales (net) Purchases (net) 2005-2007 2017 2018 2019 2005-2007 2017 Per Region economy 2018 2019 Canada 51 187 -9828 24 954 24 649 26 292 72 747 63 141 46 943 7995 57 397 11 189 7 646 94372 Memorandum China United Kingdom United Stack European Union Developed economies World 8997 150 359 123 609 409 619 634 894 8255 31 178 SOR 912 139 441 568 909 198 70 361 943 688 859 48 653 156 707 157 810 411 080 6592 96 859 129 OOR 361 111 604 617 130 876 128 184 115 333 174 332 463 966 72 400 253 354 304 068 701 976 13 429 104 147 142 845 462 055 729 178 693 962 815 728 490 778 729 178 693 962 815 726 490 778 Announced greenfield investment project overview, 20052007 average, 2017-2019 (Millions of dollars) As destination As source Regionleconomy 2005-2007 2017 2018 2019 2017 2018 2019 2005-2007 Pre- aga Canada 17 936 15 256 48 514 11 534 24354 12 234 19 159 20137 54100 28 328 48 192 Memorandum China United Kingdom United States European Union Developed economies World 100 418 26 574 41 596 183 806 278 304 744 467 93 882 152 419 300 960 599 077 111 464 38 849 74 472 211 729 377 286 982 455 61 999 36 078 101 210 198 215 345 740 845 921 14 881 55 600 138 483 288 185 558 152 744 467 48 819 33 347 119 218 245 206 464 826 699 077 75 376 44 496 172 073 342 992 638 521 982 455 137 056 308 345 565 357 845 921 Source: UNCTAD, World Investment Report 2020, https:/unctad.org/wir or https:/unctad.org/distatistics. "Excluding Caribbean offshore financial centres Foreign direct investment (FDI) overview, selected years (Millions of dollars and per cent) as a percentage of gross fixed capital formation 2005-2007 2016 2017 2018 2019 2005-2007 2016 2017 2018 2019 EDIflows Canada Inward Outward 22.5 7.1 13.1 67 602 46 126 36 066 69 507 26 522 78 348 43 459 49 879 50 332 76 602 10.4 20.0 11.2 12.9 15.4 20.0 6.9 2.6 76 214 18 800 133 711 196 149 136 315 158 290 138 305 143 040 141 225 117 120 2.9 4.2 2.3 2.4 2.3 1.9 1.7 3.1 169 046 168 515 258 699 -37 606 101 241 117 547 65 300 41 425 59137 31 480 342 34.1 55.5 -8.1 22.0 25.6 13.5 8.6 12.3 6.5 Memorandum China Inward Outward United Kingdom Inward Outward United States Inward Outward European Union Inward Outward Developed economies Inward Outward World Inward Outward 185 964 211 036 471 792 289 261 277 258 300 378 253 561 -90 623 246 215 124 899 5.9 6.7 12.5 7.6 6.9 7.5 6.0 -2.1 5.6 2.8 613 392 815 885 591 331 448 426 465 077 511 816 415 117 345 280 446 898 455 245 176 23.4 17.9 13.6 13.2 14,6 10.8 90 11.4 11.7 936 298 1 223 855 1 265 245 1 103 818 950 150 1 095 155 761 391 534 028 800 239 916 879 11.0 14.4 13.7 11.9 9.7 11.2 7.5 8.6 5.1 1 414 326 1 983 478 1 700 468 1 451 765 1 543 239 1 600 984 1 495 223 986 351 1 539 880 1 313770 113 10.6 6.9 7.0 11.8 8.0 4.6 6.0 as a percentage of gross domestic product 2005 2010 2015 2018 2019 2005 2010 2015 2018 2019 638 650 692 287 983 880 983 889 806 298 1 156 042 852 196 1037092 1 366 192 1652 480 544 590 60.8 60.8 51.8 74.3 49.7 79.6 59.7 95.2 272 094 57206 586 882 1219 930 317 211 1 097 865 1 628 261 1 769 486 1 982 270 2099 400 119 25 9.7 5.3 11.0 9.9 11.8 14.3 12.1 144 788 150 1 068 187 1 239 296 1 686 260 1 530 629 1 930 484 2075 271 1 605 422 1788 225 1949 442 31.0 488 43.1 68.1 52.3 548 67.4 62.4 73.4 68.9 EDI Stock Canada Inward Outward Memorandum China Inward Outward United Kingdom Inward Outward United States Inward Outward European Union Inward Outward Developed economies Inward Outward World Inward Outward 2 817 970 3 422 293 5731 383 7432 134 9465 835 3 637 996 4 809 687 6059 272 6452 718 7 721 713 216 27.9 22.8 32.1 314 33.2 36.1 31.4 44.2 36.0 54.3 4 371 115 7028 467 8941 981 10 589 173 11 068 993 5070 936 8675 008 10 443 337 11 863 267 12 573 803 30.3 35.1 41.2 50,9 56.3 63.1 60.2 68.3 243 31.3 40.1 43.7 8 528 656 13 137 112 17 438 602 21 511 507 24 285 679 10 570 776 17078498 20 728 700 23 569 286 25 223 359 48.8 52.7 30.1 40.7 47.0 11 431 253 19 922 422 28 577 573 32 943 943 36 470 162 11 908 631 20 465 356 28 574 874 31 507 549 34 571 124 24.1 253 30.2 31.2 35.6 35.9 38.5 37.1 42.0 400 Cross-border merger and acquisition overview, 2005-2007 average, 2017-2019 (Millions of dollars) Sales (net) Purchases (net) 2005-2007 2017 2018 2019 2005-2007 2017 Per Region economy 2018 2019 Canada 51 187 -9828 24 954 24 649 26 292 72 747 63 141 46 943 7995 57 397 11 189 7 646 94372 Memorandum China United Kingdom United Stack European Union Developed economies World 8997 150 359 123 609 409 619 634 894 8255 31 178 SOR 912 139 441 568 909 198 70 361 943 688 859 48 653 156 707 157 810 411 080 6592 96 859 129 OOR 361 111 604 617 130 876 128 184 115 333 174 332 463 966 72 400 253 354 304 068 701 976 13 429 104 147 142 845 462 055 729 178 693 962 815 728 490 778 729 178 693 962 815 726 490 778 Announced greenfield investment project overview, 20052007 average, 2017-2019 (Millions of dollars) As destination As source Regionleconomy 2005-2007 2017 2018 2019 2017 2018 2019 2005-2007 Pre- aga Canada 17 936 15 256 48 514 11 534 24354 12 234 19 159 20137 54100 28 328 48 192 Memorandum China United Kingdom United States European Union Developed economies World 100 418 26 574 41 596 183 806 278 304 744 467 93 882 152 419 300 960 599 077 111 464 38 849 74 472 211 729 377 286 982 455 61 999 36 078 101 210 198 215 345 740 845 921 14 881 55 600 138 483 288 185 558 152 744 467 48 819 33 347 119 218 245 206 464 826 699 077 75 376 44 496 172 073 342 992 638 521 982 455 137 056 308 345 565 357 845 921 Source: UNCTAD, World Investment Report 2020, https:/unctad.org/wir or https:/unctad.org/distatistics. "Excluding Caribbean offshore financial centres