

Answered step by step
Verified Expert Solution
Question
1 Approved Answer
The world population data spans from 1 9 6 0 to 2 0 1 7 . We'd like to build a predictive model that can
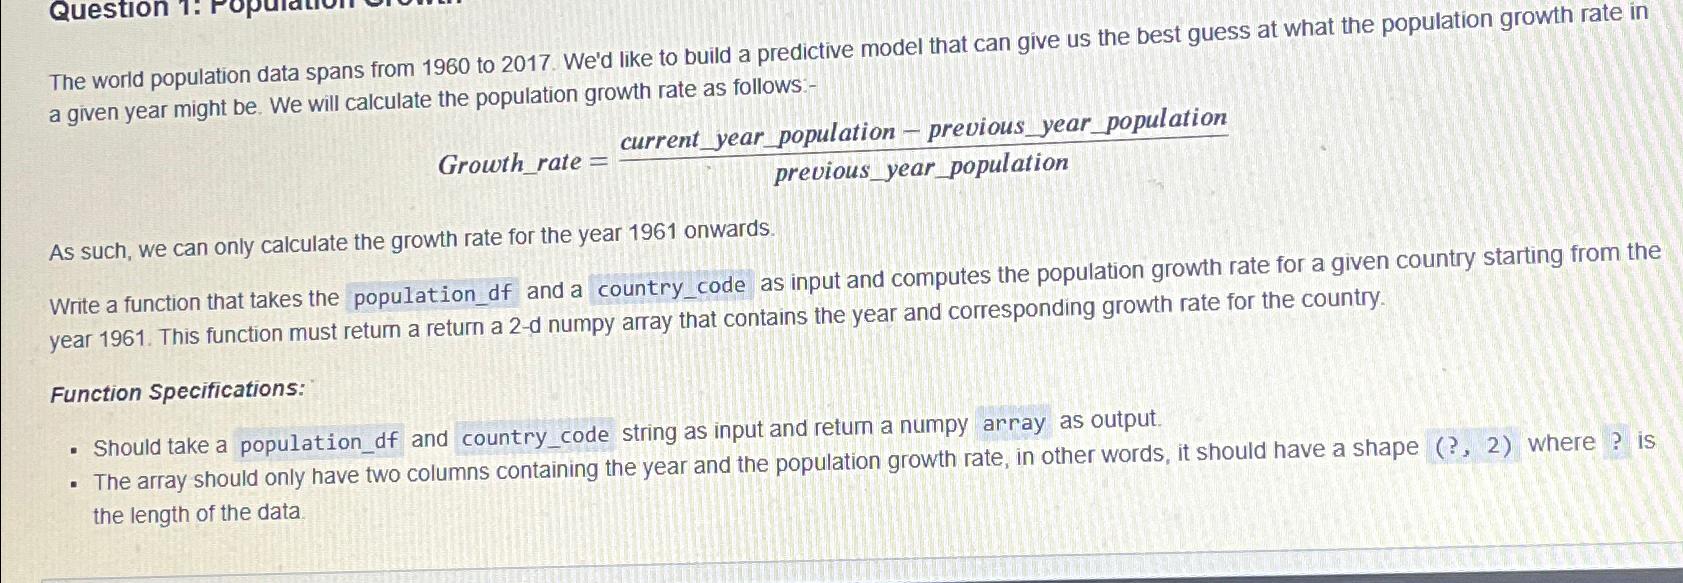
The world population data spans from to We'd like to build a predictive model that can give us the best guess at what the population growth rate in a given year might be We will calculate the population growth rate as follows:
ate
As such, we can only calculate the growth rate for the year onwards.
Write a function that takes the populationdf and a countrycode as input and computes the population growth rate for a given country starting from the year This function must retum a return a d numpy array that contains the year and corresponding growth rate for the country.
Function Specifications:
Should take a populationdf and countrycode string as input and retum a numpy array as output.
The array should only have two columns containing the year and the population growth rate, in other words, it should have a shape where is the length of the data.
Step by Step Solution
There are 3 Steps involved in it
Step: 1

Get Instant Access to Expert-Tailored Solutions
See step-by-step solutions with expert insights and AI powered tools for academic success
Step: 2

Step: 3
Ace Your Homework with AI
Get the answers you need in no time with our AI-driven, step-by-step assistance
Get Started
Database Processing
Authors: David Kroenke
11th Edition
0132302675, 9780132302678