Answered step by step
Verified Expert Solution
Question
1 Approved Answer
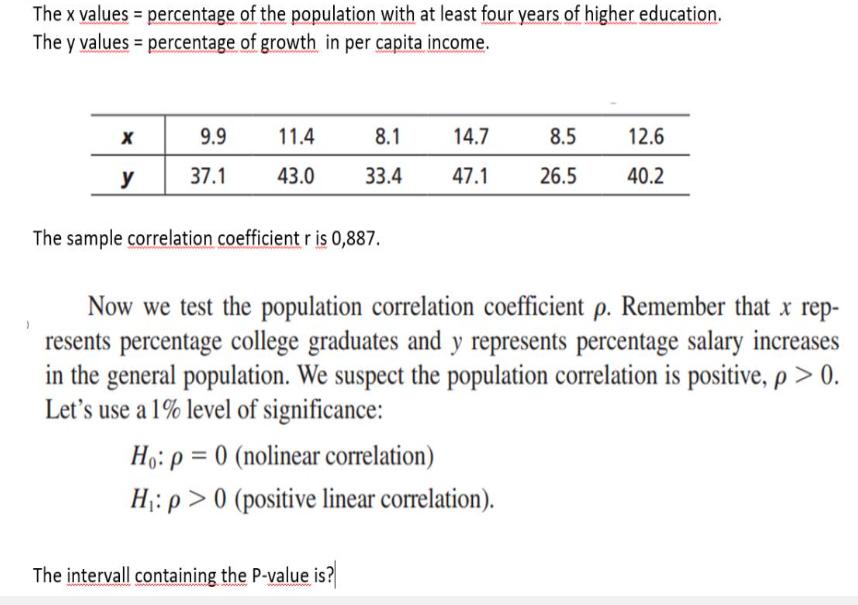
The x values - percentage of the population with at least four years of higher education. The y values= percentage of growth in per

The x values - percentage of the population with at least four years of higher education. The y values= percentage of growth in per capita income. X y 9.9 37.1 11.4 43.0 8.1 14.7 33.4 47.1 The sample correlation coefficient r is 0,887. Now we test the population correlation coefficient p. Remember that x rep- resents percentage college graduates and y represents percentage salary increases in the general population. We suspect the population correlation is positive, p > 0. Let's use a 1% level of significance: Ho: p= 0 (nolinear correlation) H: p>0 (positive linear correlation). The intervall containing the P-value is? 8.5 12.6 26.5 40.2
Step by Step Solution
★★★★★
3.46 Rating (149 Votes )
There are 3 Steps involved in it
Step: 1
To determine the interval containing the pvalue for the hypothesis test we need additional informati...
Get Instant Access to Expert-Tailored Solutions
See step-by-step solutions with expert insights and AI powered tools for academic success
Step: 2

Step: 3

Ace Your Homework with AI
Get the answers you need in no time with our AI-driven, step-by-step assistance
Get Started


