Question
The XYZ Aircraft Company. is ready to begin a project to develop a new fighter airplane for the Chinese Air Force. The companys contract with
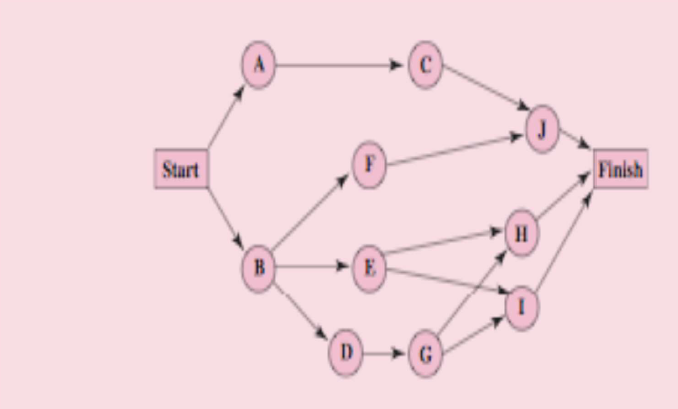
The XYZ Aircraft Company. is ready to begin a project to develop a new fighter airplane for the Chinese Air Force. The companys contract with the Department of Defence calls for project completion within 100 weeks, with penalties imposed for late delivery. The project involves 10 activities (labelled A, B, . . ., J), where their precedence relationships are shown in the following project network.

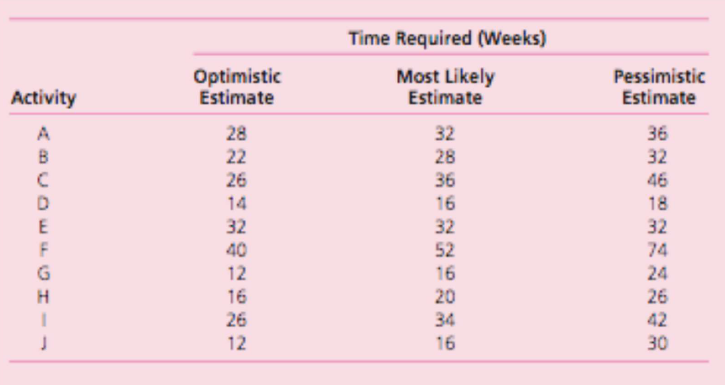
Using the PERT three-estimate approach, the usual three estimates of the duration of each activity have been obtained as given in Table 1. Table 1

(a) Develop spreadsheet models to answer the following: (i) Find the estimate of the mean and variance of the duration of each activity. (ii) Find the mean critical path. (iii) Find the approximate probability that the project will finish within 100 weeks.
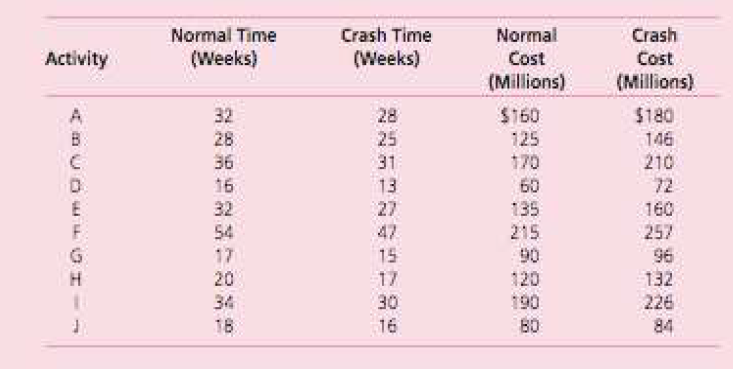
(b) The management would like to avoid the hefty penalties for missing the deadline in the current contract. Therefore, the decision has been made to crash the project using the CPM method of timecost trade-offs to determine how to do this in the most economical way. The data needed to apply this method is given Table 2.

These normal times are the rounded estimates of the means obtained from the original data from (a). Taking the information obtained in (a) the decision is made to require that the estimated project duration based on means (as used throughout the CPM analysis) must not exceed 92 weeks. Formulate and solve a spreadsheet model that fits linear programming for this problem.
(c) Construct a spreadsheet model to show the budget and schedule of the costs based on earliest and latest times.
(d) Use the spreadsheet model of (c) to produce a suitable chart to show the schedule of cumulative project costs when all activities begin at their earliest start times or at their latest start times.
Start F Finish B E D Activity Optimistic Estimate 28 Time Required (Weeks) Most Likely Estimate 32 28 36 16 32 52 22 26 B D E F Pessimistic Estimate 36 32 46 18 32 14 32 40 74 12 16 H 16 26 12 20 34 24 26 42 30 16 Normal Time (Weeks) Crash Time (Weeks) Activity Crash Cost (Millions) $180 146 210 32 28 36 16 32 54 17 28 25 31 13 27 42 15 Normal Cost (Millions) $160 125 170 60 135 215 90 120 190 60 E G H ! 160 257 96 132 226 84 17 34 16 30 16Step by Step Solution
There are 3 Steps involved in it
Step: 1

Get Instant Access to Expert-Tailored Solutions
See step-by-step solutions with expert insights and AI powered tools for academic success
Step: 2

Step: 3

Ace Your Homework with AI
Get the answers you need in no time with our AI-driven, step-by-step assistance
Get Started


