

Question
The years 19951999 were the five greatest consecutive years in the stock market in terms of performance. They were followed by three years of significant
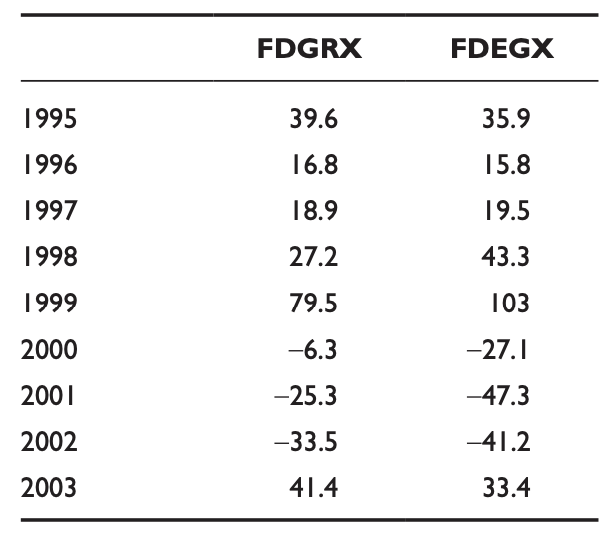
The years 19951999 were the five greatest consecutive years in the stock market in terms of performance. They were followed by three years of significant declines and a recovery in 2003. The data below show the percentage annual returns for two Fidelity funds, Fidelity Growth (symbol=FDGRX) and Fidelity Aggressive Growth (symbol=FDEGX). Note that the performance of both funds mirrored that of the mar- ket, showing strong positive returns the first five years, followed by three years of negative returns and then positive performance in 2003.
PLEASE ANSWER ALL PARTS AND SHOW THE FORMULAS ON THE EXCEL SPREADSHEET
A. Calculate the average performance for each fund for the nineyear period. Use the spreadsheet function {=Average (B2:B9)} where B2:B9 represents the cells with the first funds annual returns.
B. Now calculate how much $10,000 invested in each fund at the beginning of 1995 would have grown to by the end of 1999, when the market was booming. To do this, construct two new columns, one for each fund, showing the decimal equiva- lent of the funds return added to 1.0 (call this the return relativeto find it, divide each return by 100 and add 1.0). For example, for FDGRX, the first entry would be 1.396. Then for each fund multiply $10,000 by each of the first five return rela- tives in turn. How much money would an investor in each fund have at the end of 1999? Which fund performed better up to that point?
C. Using the answer determined in (b), calculate the amount of money an investor would have in each fund at the end of 2003. Do this in a manner similar to (b), compounding the result you found at the end of 1999 by each of the four remain- ing return relatives.
D. What is the difference in ending wealth between the two funds, having started with $10,000 in each fund?
E. Now calculate the average annual total return (geometric mean) for each fund using the spreadsheet function {=geomean (D2:D9)} assuming, for example, that the return relatives for one fund are in the cells D2:D9.
F. How does the difference in the average annual total returns for each fund compare to the arithmetic averages for each over the nineyear period?
FDGRX FDEGX 1995 39.6 35.9 1996 16.8 15.8 1997 18.9 19.5 1998 27.2 43.3 1999 79.5 103 2000 -6.3 -27.1 2001 -25.3 -47.3 2002 -33.5 -41.2 2003 41.4 33.4Step by Step Solution
There are 3 Steps involved in it
Step: 1

Get Instant Access to Expert-Tailored Solutions
See step-by-step solutions with expert insights and AI powered tools for academic success
Step: 2

Step: 3
Ace Your Homework with AI
Get the answers you need in no time with our AI-driven, step-by-step assistance
Get Started
The Doctrine Of Equivalents Or An Explanation Of The Nature Value And Power Of Money
Authors: George Craufurd
1st Edition
054833952X, 9780548339527