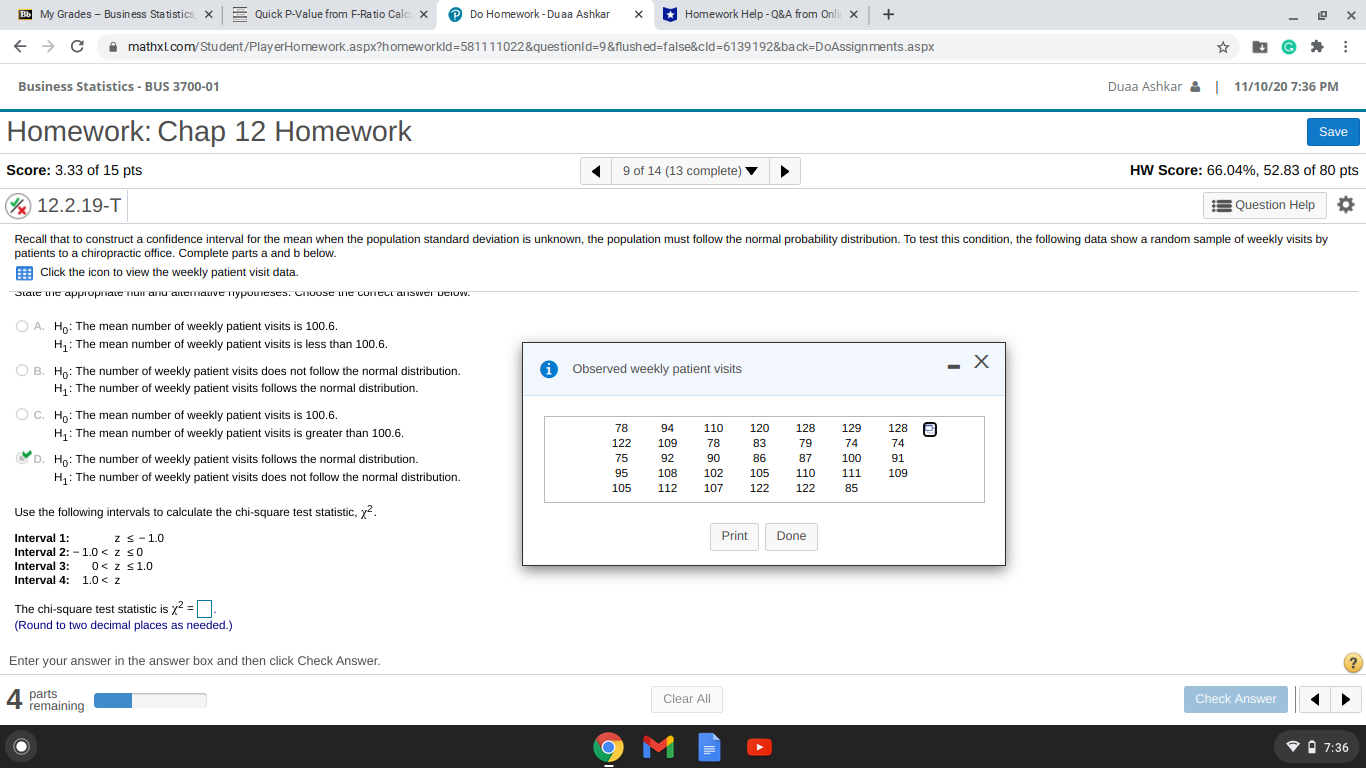
Thechi-square test statistic is 2=
(Round to two decimal places asneeded.)
Thechi-square critical value is 2=
(Round to three decimal places asneeded.
Draw the proper conclusion.
Do not reject/reject the null hypothesis. There is not/is enough evidence to conclude that the number of weekly patient visits follows the normal distribution.
b. Determine thep-value and interpret its meaning.
Thep-value is
(Round to three decimal places asneeded.)
Interpret thep-value.
Thep-value is the probability of observing a test statistic equal to/less/greater the part astatistic, assuming the distribution of the variable does not follow the normal distribution.
Bb My Grades - Business Statistics. X Quick P-Value from F-Ratio Calc X Do Homework - Duaa Ashkar X *Homework Help - Q&A from Onlit x + X C A mathxl.com/Student/PlayerHomework.aspx?homeworkld=5811 11022&questionld=9&flushed=false&cld=6139192&back=DoAssignments.aspx Business Statistics - BUS 3700-01 Duaa Ashkar & | 11/10/20 7:36 PM Homework: Chap 12 Homework Save Score: 3.33 of 15 pts 9 of 14 (13 complete) HW Score: 66.04%, 52.83 of 80 pts X 12.2.19-T Question Help Recall that to construct a confidence interval for the mean when the population standard deviation is unknown, the population must follow the normal probability distribution. To test this condition, the following data show a random sample of weekly visits by patients to a chiropractic office. Complete parts a and b below. Click the icon to view the weekly patient visit data. State me appropriate null anu antemauve nyponieses. CHOUSE lic CUncut answer UCIOW. O A. Ho: The mean number of weekly patient visits is 100.6. H1: The mean number of weekly patient visits is less than 100.6. O B. Ho: The number of weekly patient visits does not follow the normal distribution. i Observed weekly patient visits - X Hy: The number of weekly patient visits follows the normal distribution. O C. Ho: The mean number of weekly patient visits is 100.6. Hy: The mean number of weekly patient visits is greater than 100.6. 78 94 110 78 120 128 129 74 128 122 109 75 83 79 74 D. Ho: The number of weekly patient visits follows the normal distribution. 92 90 86 87 100 91 Hy: The number of weekly patient visits does not follow the normal distribution. 95 108 102 105 110 111 109 105 112 107 122 122 85 Use the following intervals to calculate the chi-square test statistic, x2. Interval 1: z S -1.0 Print Done Interval 2: - 1.0