Answered step by step
Verified Expert Solution
Link Copied!

Question

1 Approved Answer

THEORY QUESTIONS 3. The mean temperature in Waikiki, Hawaii is 27'C in December with a standard deviation of 2.7C. The mean temperature in Key West,

THEORY QUESTIONS
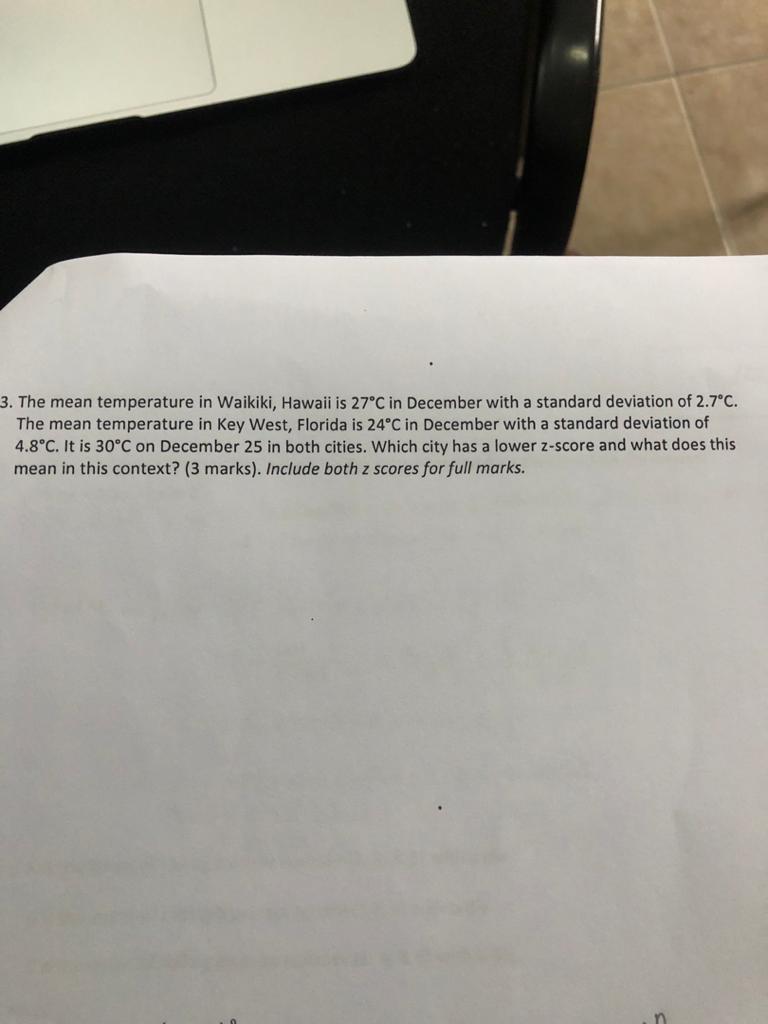
image text in transcribedimage text in transcribedimage text in transcribedimage text in transcribedimage text in transcribed
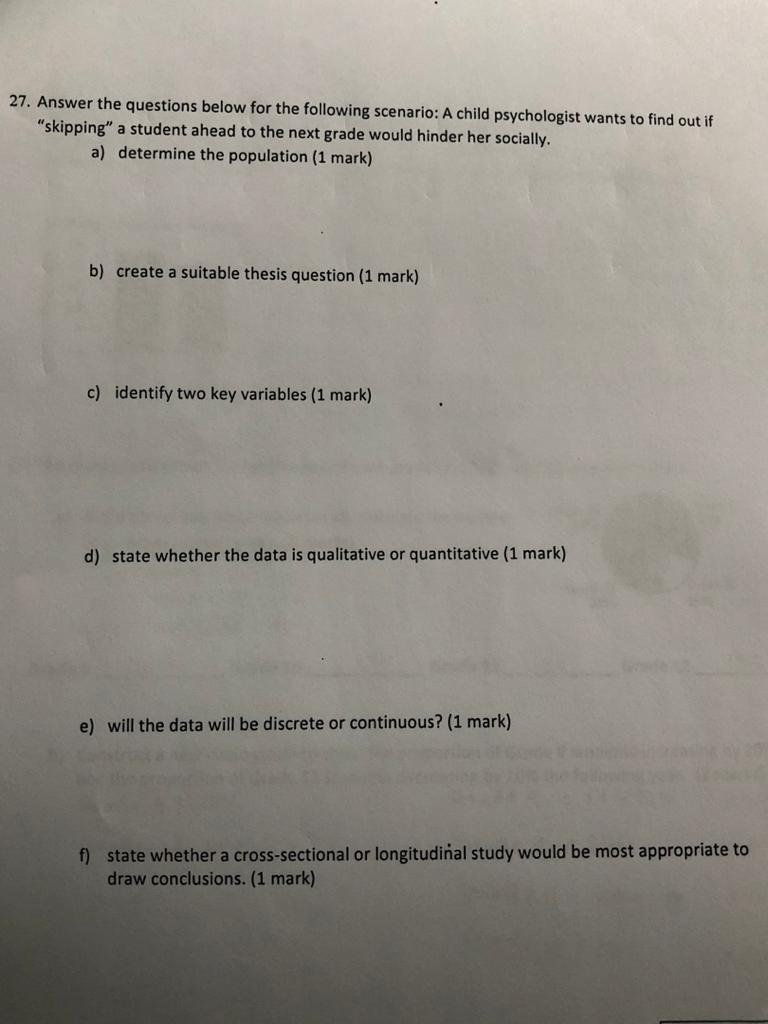
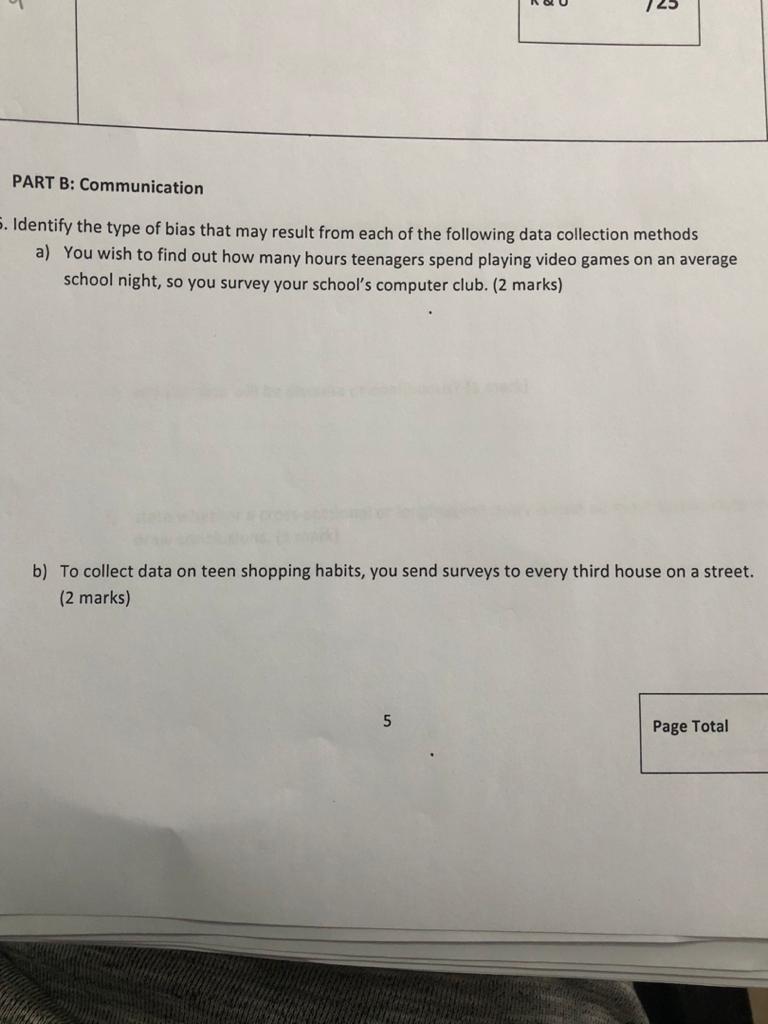
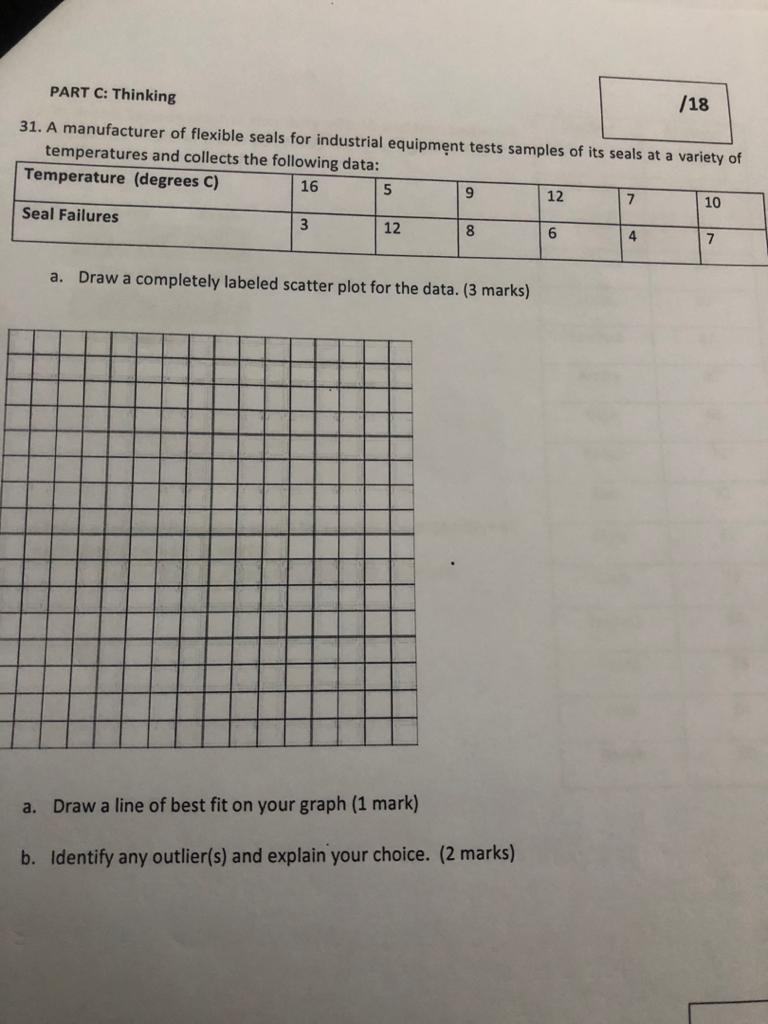
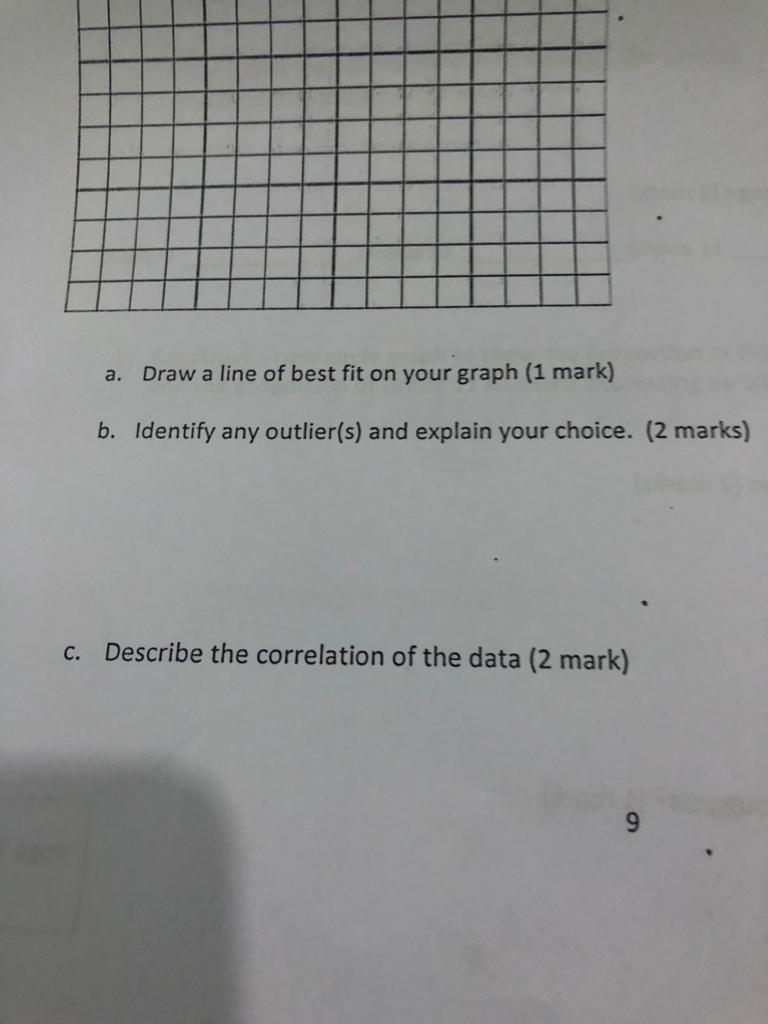
3. The mean temperature in Waikiki, Hawaii is 27'C in December with a standard deviation of 2.7"C. The mean temperature in Key West, Florida is 24"C in December with a standard deviation of 4.8 C. It is 30"C on December 25 in both cities. Which city has a lower z-score and what does this mean in this context? (3 marks). Include both z scores for full marks.27. Answer the questions below for the following scenario: A child psychologist wants to find out if "skipping" a student ahead to the next grade would hinder her socially. a) determine the population (1 mark) b) create a suitable thesis question (1 mark) c) identify two key variables (1 mark) d) state whether the data is qualitative or quantitative (1 mark) e) will the data will be discrete or continuous? (1 mark) f) state whether a cross-sectional or longitudinal study would be most appropriate to draw conclusions. (1 mark)PART B: Communication Identify the type of bias that may result from each of the following data collection methods a) You wish to find out how many hours teenagers spend playing video games on an average school night, so you survey your school's computer club. (2 marks) b) To collect data on teen shopping habits, you send surveys to every third house on a street. (2 marks) 5 Page Total/18 PART C: Thinking 31. A manufacturer of flexible seals for industrial equipment tests samples of its seals at a variety of temperatures and collects the following data: Temperature (degrees C) 16 5 9 12 7 10 Seal Failures 3 12 8 6 7 a. Draw a completely labeled scatter plot for the data. (3 marks) a. Draw a line of best fit on your graph (1 mark) b. Identify any outlier(s) and explain your choice. (2 marks)a. Draw a line of best fit on your graph (1 mark) b. Identify any outlier(s) and explain your choice. (2 marks) c. Describe the correlation of the data (2 mark)

Step by Step Solution

There are 3 Steps involved in it

Step: 1

blur-text-image

Get Instant Access to Expert-Tailored Solutions

See step-by-step solutions with expert insights and AI powered tools for academic success

Step: 2

blur-text-image_2

Step: 3

blur-text-image_3

Ace Your Homework with AI

Get the answers you need in no time with our AI-driven, step-by-step assistance

Get Started

Recommended Textbook for

Finite Math And Applied Calculus

Authors: Stefan Waner, Steven Costenoble

7th Edition

1337515566, 9781337515566

More Books

Students also viewed these Mathematics questions