Answered step by step
Verified Expert Solution
Link Copied!

Question

1 Approved Answer

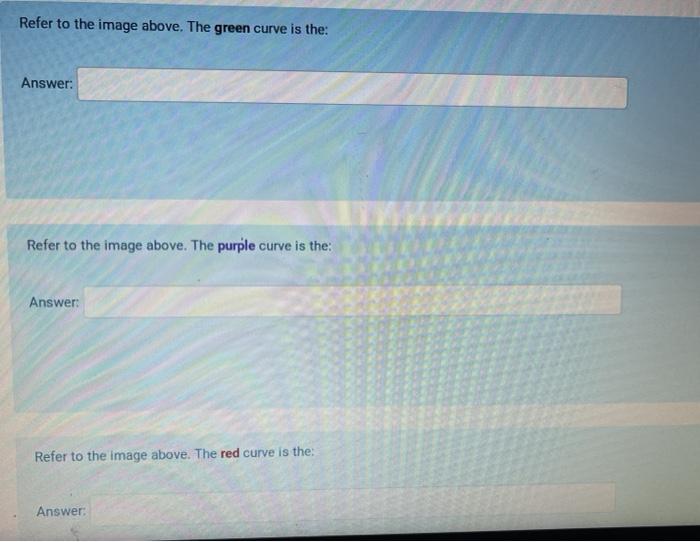
there all one question, but need to explain the colored curves. surpluses 0% deficits year 1 year 2 Refer to the image above. The green

there all one question, but need to explain the colored curves. image text in transcribed
image text in transcribed
surpluses 0% deficits year 1 year 2 Refer to the image above. The green curve is the: Answer: Refer to the image above. The purple curve is the: Answer: Refer to the image above. The red curve is the Answer: Refer to the figure above. What is shown by the difference between the red curve and the green curve? Answer: Refer to the figure above. Why does the red curve show a smoother business cycle than the purple curve? Because: Answer: Refer to the figure above. Under what conditions could you say that the fiscal policy stance in year 1 was pro-cyclical

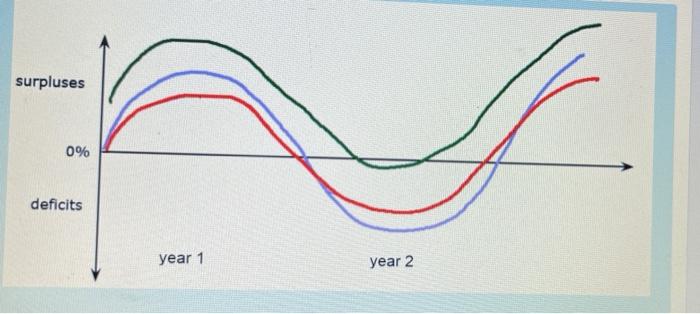
Step by Step Solution

There are 3 Steps involved in it

Step: 1

blur-text-image

Get Instant Access to Expert-Tailored Solutions

See step-by-step solutions with expert insights and AI powered tools for academic success

Step: 2

blur-text-image

Step: 3

blur-text-image

Ace Your Homework with AI

Get the answers you need in no time with our AI-driven, step-by-step assistance

Get Started

Recommended Textbook for

Knowledge Based System For Information System Audit

Authors: Amol B. Devale, R. V. Kulkarni

1st Edition

6200652376, 978-6200652379

More Books

Students also viewed these Accounting questions