Answered step by step
Verified Expert Solution
Question
1 Approved Answer
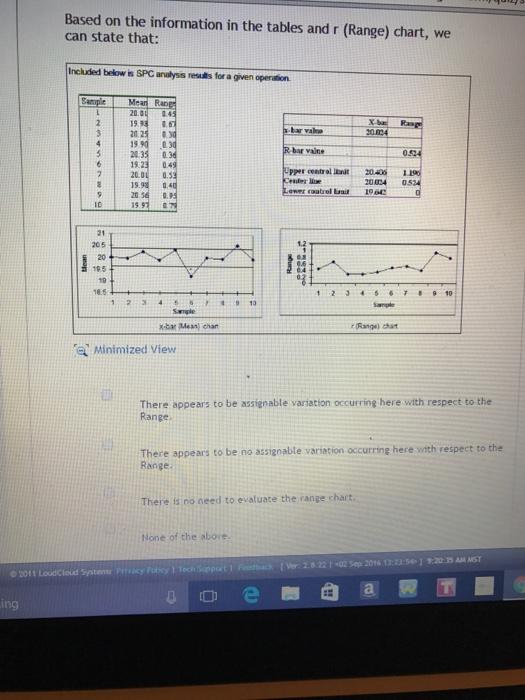
Based on the information in the tables and r (Range) chart, we can state that: Included below is SPC analysis resuts for a given

Based on the information in the tables and r (Range) chart, we can state that: Included below is SPC analysis resuts for a given operation Mean Rang 20.00 Sample 145 19.8 20. 25 19 90 20.35 19.23 20.0L 19.98 20 36 19.97 X- 20004 Rang R-bar valne 0524 0.49 0.59 0.40 0.95 pper centrol lit Center e Lewer coutrel laait 20400 2004 1196 0524 21 205 20 195 19 18.5 9 10 Sample Sample K-bar Mean chan (Range) chat a Minimized View There appears to be assignable variation oCcurring here with respect to the Range. There appears to be no assignable variation occurring here with respect to the Range. There is no need to evaluate the range chart. None of the abore. Ver 282202 Sep 201 se 1:20AM NST 2011 Loudcleud Systen ky Py TeciReport Ling
Step by Step Solution
★★★★★
3.34 Rating (148 Votes )
There are 3 Steps involved in it
Step: 1
Answer There appears to be no assignable variation occurring here with ...
Get Instant Access to Expert-Tailored Solutions
See step-by-step solutions with expert insights and AI powered tools for academic success
Step: 2

Step: 3

Ace Your Homework with AI
Get the answers you need in no time with our AI-driven, step-by-step assistance
Get Started


