Answered step by step
Verified Expert Solution
Link Copied!

Question

1 Approved Answer

There are 5 graphs. Look at each of the graphs below. Need a brief explanation of why each of the graphs is misleading. Brand C

There are 5 graphs. Look at each of the graphs below. Need a brief explanation of why each of the graphs is misleading.
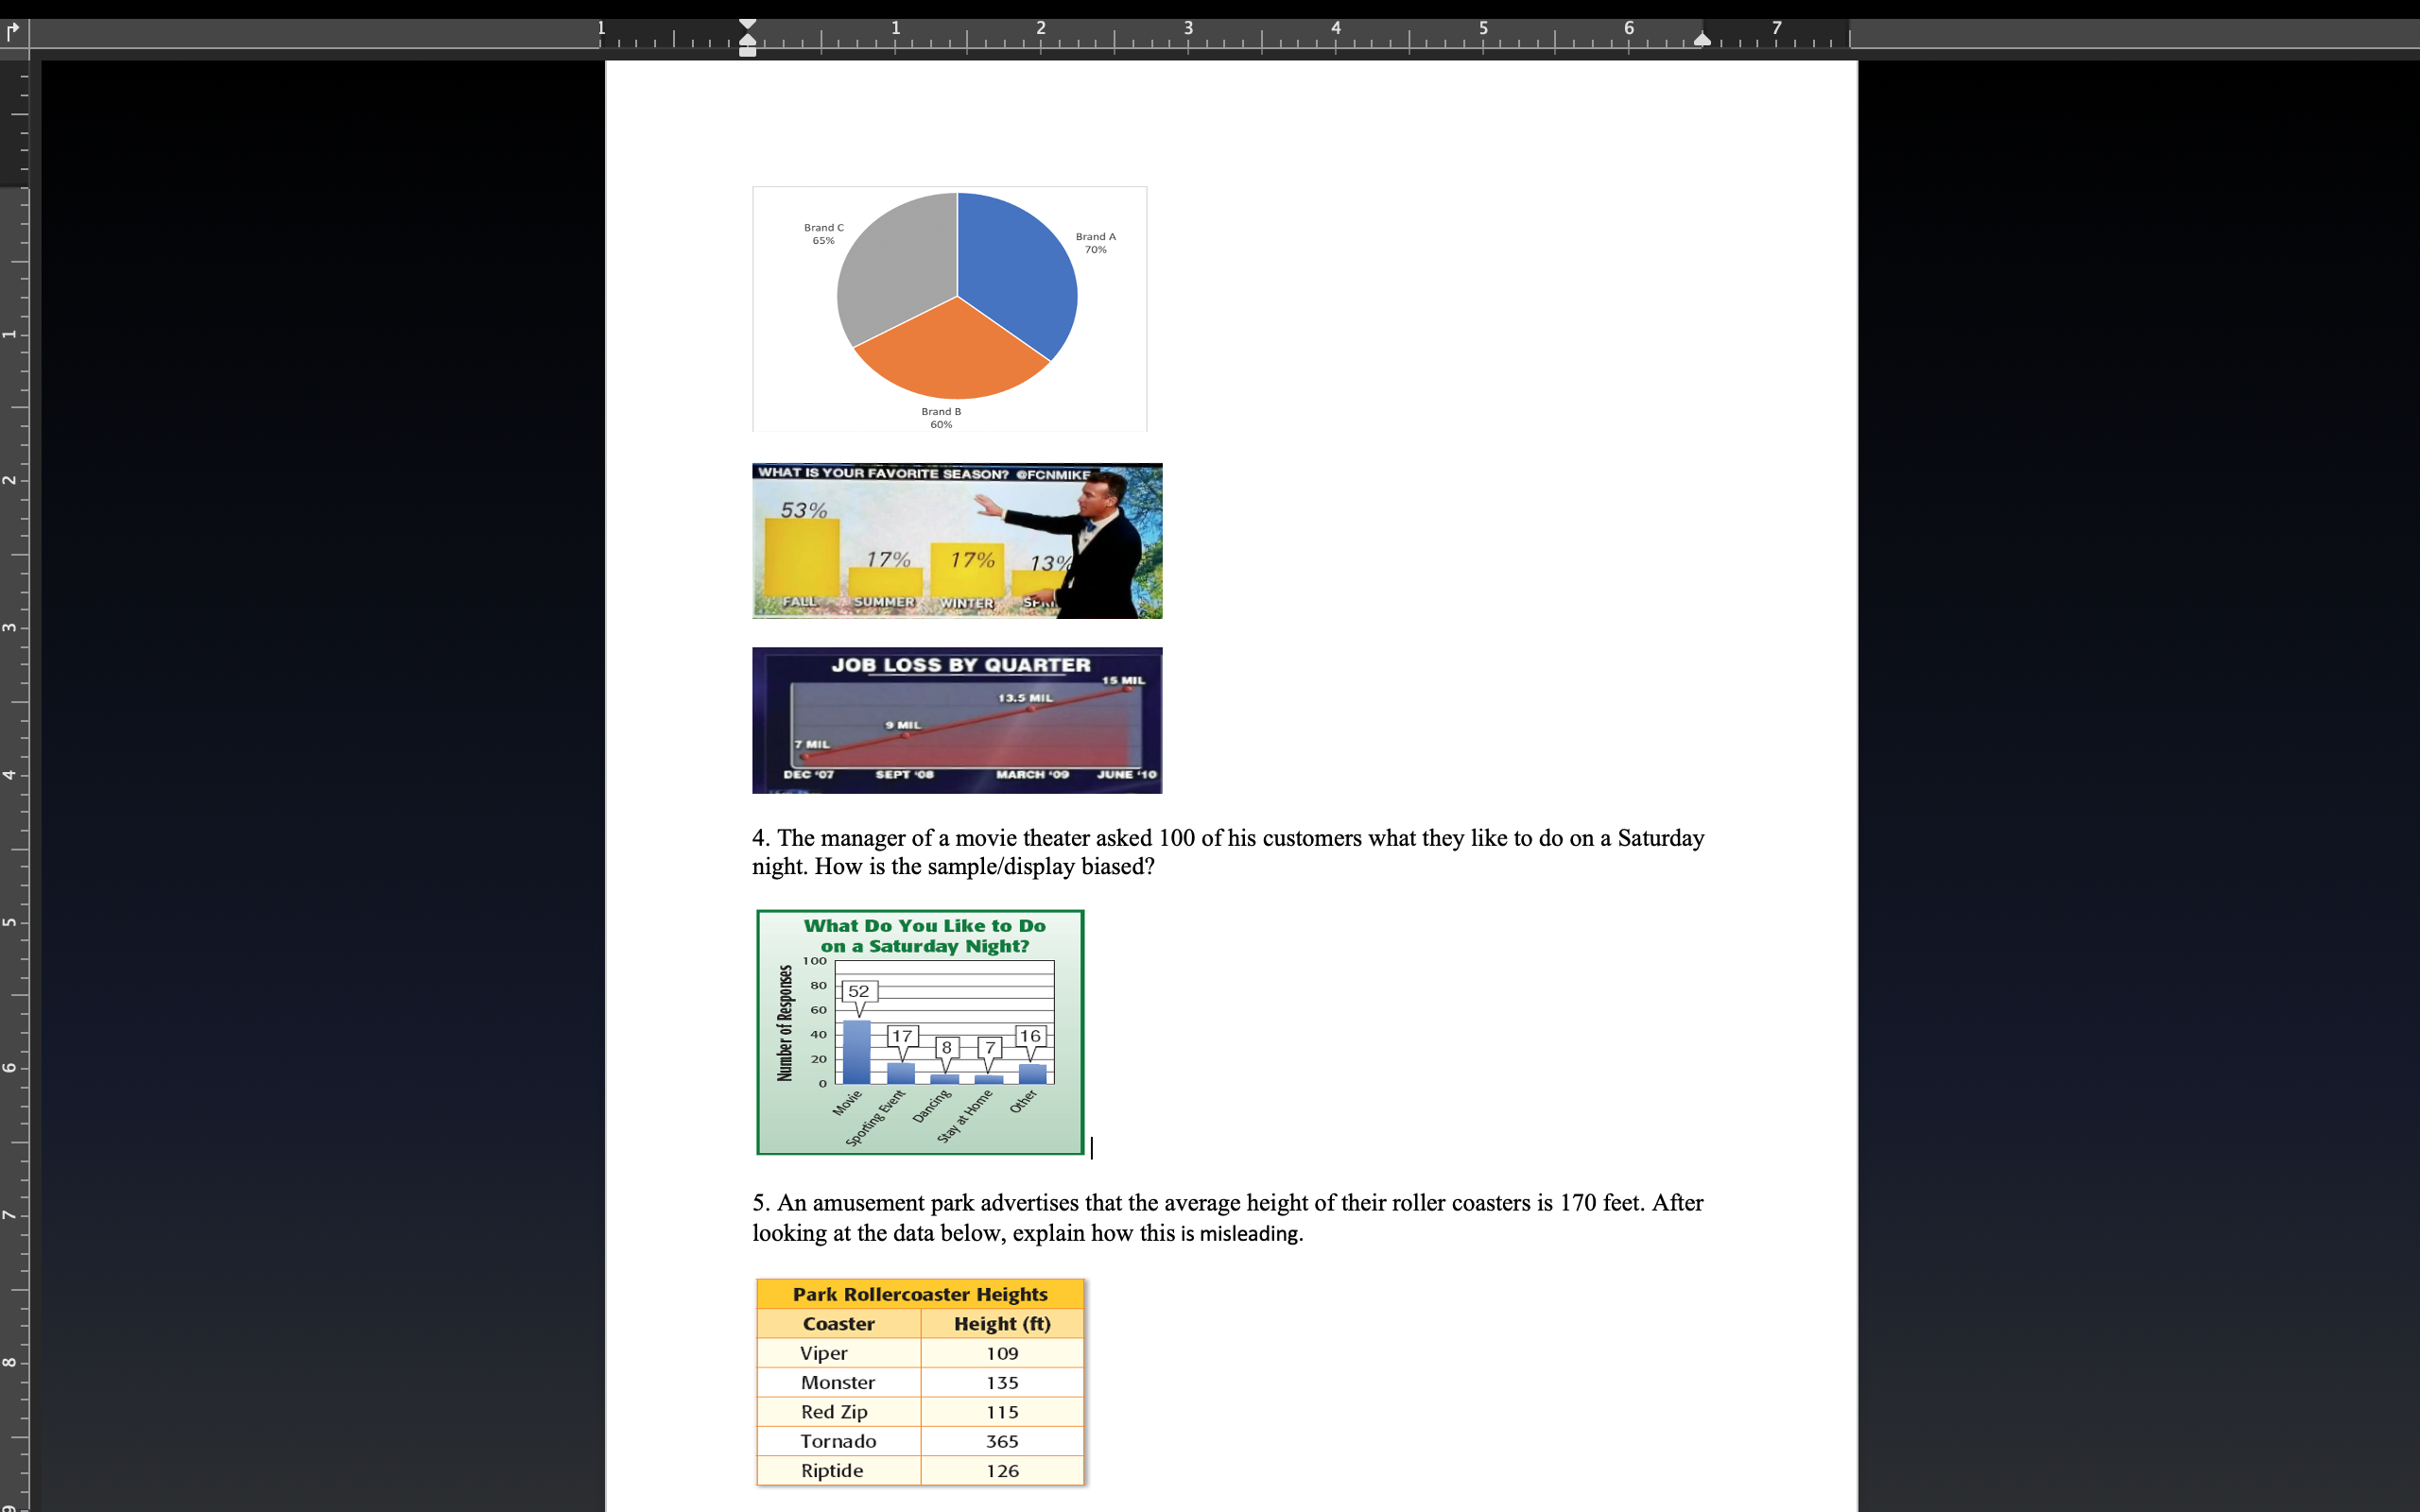
image text in transcribed
Brand C 70% rand 60% WHAT IS YOUR FAVORITE SEASON? @FONMIKE 53% 17% 17% 13% FALL SUMMER WINTER SPIN JOB LOSS BY QUARTER 15 MIL 13.5 MIL DEC .07 SEPT 108 MARCH '09 JUNE 10 4. The manager of a movie theater asked 100 of his customers what they like to do on a Saturday night. How is the sample/display biased? What Do You Like to Do on a Saturday Night? 100 80 52 50 Number of Responses 40 20 17 8 7 16 Movie 5. An amusement park advertises that the average height of their roller coasters is 170 feet. After looking at the data below, explain how this is misleading. Park Rollercoaster Heights Coaster Height (ft) Viper 109 Monster 135 Red Zip 115 Tornado 365 Riptide 126

Step by Step Solution

There are 3 Steps involved in it

Step: 1

blur-text-image

Get Instant Access to Expert-Tailored Solutions

See step-by-step solutions with expert insights and AI powered tools for academic success

Step: 2

blur-text-image

Step: 3

blur-text-image

Ace Your Homework with AI

Get the answers you need in no time with our AI-driven, step-by-step assistance

Get Started

Recommended Textbook for

An Introduction to the Mathematics of financial Derivatives

Authors: Salih N. Neftci

2nd Edition

978-0125153928, 9780080478647, 125153929, 978-0123846822

More Books

Students also viewed these Mathematics questions

Question

How does it affect me?

Answered: 1 week ago