Question
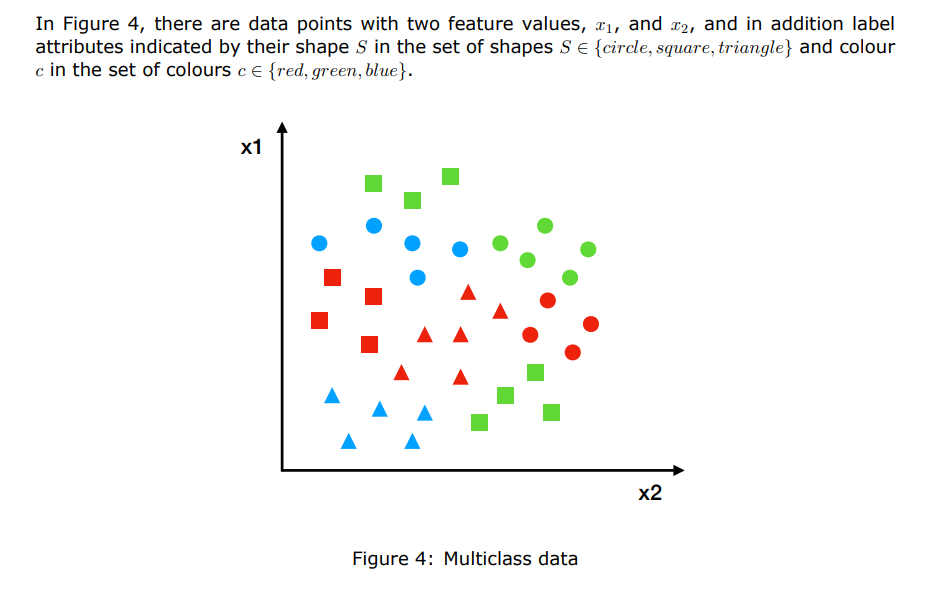
There are data points with two feature values, x1, and x2, and in addition label attributes indicated by their shape S in the set of
There are data points with two feature values, x1, and x2, and in addition label attributes indicated by their shape S in the set of shapes S {circle, square, triangle} and colour c in the set of colours c {red, green, blue}.
You must simplify this dataset into a binary set of labels of crosses and naughts, by creating a small set of rules that turn a particular shape and colour data point to either a naught or cross, losing all information about their previous shape and colour in the process. Your set of rules must cover all possible combinations of shapes and colours, turning each coloured shape into either a naught or a cross, and should result in a balanced dataset of roughly equal numbers of naughts and crosses. Multiple solutions are possible. Provide the answer as a list of rules. If the last digit of your student ID is divisible by 2, your naughts must include the red squares, otherwise it must include the blue circles. If the last digit of your student ID is divisible by 3, your crosses must include the blue triangles, otherwise it must include the red triangles.
Draw the new diagram of noughts and crosses. In this, draw the decision boundaries created by a monothetic decision tree with perfect classification rate on the training data. Number the hyperplanes in the order they are used.
Place a new datapoint indicated by an asterisk shape at a random location in your new diagram. Then provide the class that the decision tree will infer for this data point and provide the sequence of decisions made by the decision tree to get to that prediction. Write down the decisions as equations.
Draw the decision tree that created the decision boundaries of (b). Number the nodes to indicate what decision boundary the node is responsible for, and annotate for each edge what feature is compared against, and whether going down that edge means the feature value is greater or smaller than (or equal to) the threshold.
Step by Step Solution
There are 3 Steps involved in it
Step: 1

Get Instant Access to Expert-Tailored Solutions
See step-by-step solutions with expert insights and AI powered tools for academic success
Step: 2

Step: 3

Ace Your Homework with AI
Get the answers you need in no time with our AI-driven, step-by-step assistance
Get Started


