

Question
There are five practical problems. Please submit all of your work for these in one word or excel file. Practical Problem 1 The Regina Company,
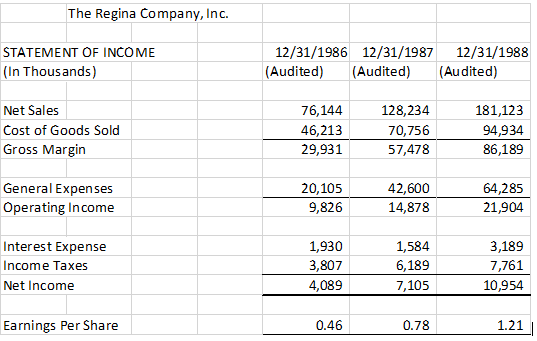
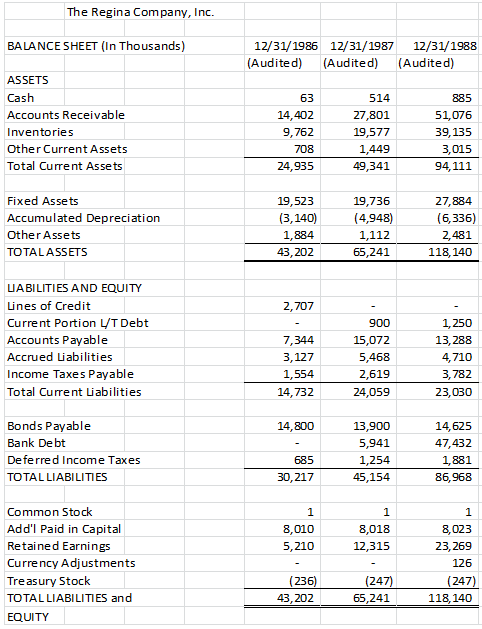
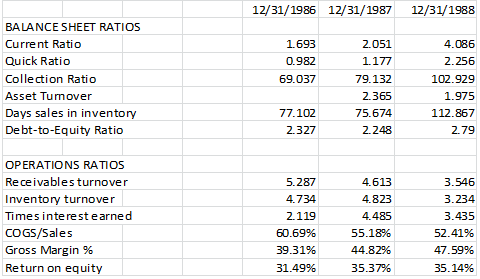
There are five practical problems. Please submit all of your work for these in one word or excel file. Practical Problem 1 The Regina Company, Inc. The Regina Company, Inc. (Regina) was engaged in the manufacture and marketing of various household equipment, such as vacuum cleaners and whirlpools. Reginas financial information follows these questions (pages 1-3, double click on Reginas financials to open them in Excel) - use these financial statements to answer the following questions:
1) Perform a vertical analysis on the financial statements.
2) Based on the results of the vertical analysis, what relationships appear to be out of alignment?
3) Is the relationship between sales and cost of goods sold linear?
4) Should the relationship between sales and cost of goods sold be linear? Why or why not?
5) Can you identify the potential fraud? If so, how did you determine there was a potential fraud? If not, what other information will help you determine whether there was a potential fraud?
The following practical problems involve the use of financial ratio comparisons to detect fraud.
Practical Problem 2
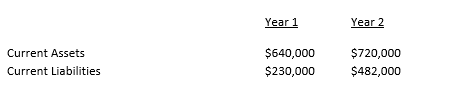
Assume the following information for Company A:
- Define ratio analysis and describe how it can be used to detect financial statement fraud.
- Calculate the current ratio for Company A for years 1 and 2.
- What is the possible fraud implication of Company As current ratio for year 2 compared to year 1?
- What additional procedures should you always follow before reaching any tentative conclusions concerning possible fraud as a result of comparisons of ratio calculations?
Practical Problem 3
The following information is given for Company B:
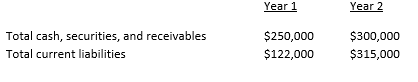
- Calculate the quick ratio for Company B for years 1 and 2.
- What is the possible fraud implication of Company Bs quick ratio?
Practical Problem 4
The following information is determined from Company Cs accounts:
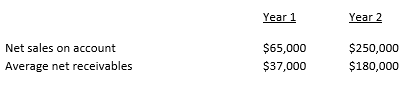
- Calculate the accounts receivable turnover for Company C for years 1 and 2.
- The accounts receivable turnover ratio measures the number of times the accounts receivable balance is turned over, or collected, during the accounting period. It indicates the possibility of fictitious sales revenue. Describe fictitious or fabricated revenue.
- Calculate the collection ratio for Company C for years 1 and 2.
- What is measured by the collection ratio?
- What are the fraud implications of Company Cs collection ratio?
Practical Problem 5
The following information is given for Company D:
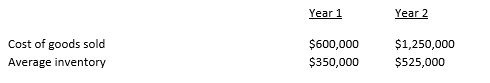
- Determine the inventory turnover for Company D for years 1 and 2.
- What is measured by the inventory turnover ratio and what are the fraud implications?
- Calculate the average number of days that inventory is in stock for years 1 and 2.
- What are some of the important aspects of the average-days-inventory-in-stock calculation?
- How might fraud examiners use the ratio and what is its significance?
The Regina Company, Inc. STATEMENT OF INCOME (In Thousands) 12/31/1986 12/31/1987 12/31/1988 (Audited) (Audited) (Audited) 181, Net Sales Cost of Goods Sold Gross Margin 76,144 46,213 29,931 128,234 70,756 57,478 181,123 94,934 86,189 General Expenses Operating Income 20,105 9,826 42,600 14,878 64,285 21,904 Interest Expense Income Taxes Net Income 1,930 3,807 4,089 1,584 6,189 7,105 3,189 7,761 10,954 Earnings Per Share 0.46 0.78 1.21 The Regina Company, Inc. BALANCE SHEET (In Thousands) 12/31/1986 (Audited) 12/31/1987 12/31/1988 (Audited) (Audited) ASSETS Cash Accounts Receivable Inventories Other Current Assets Total Current Assets 14,402 9,762 708 24,935 514 27,801 19,577 1,449 49,341 885 51,076 39,135 3,015 94, 111 Fixed Assets Accumulated Depreciation Other Assets TOTALASSETS 19,523 (3,140) 1,884 43,202 19,736 (4,948) 1,112 65,241 27,884 (6,336) 2,481 118, 140 2,707 UABILITIES AND EQUITY Lines of Credit Current Portion UT Debt Accounts Payable Accrued Liabilities Income Taxes Payable Total Current Liabilities 7,344 3,127 1,554 14,732 900 15,072 5,468 2,619 24,059 1,250 13,288 4,710 3,782 23,030 14,800 Bonds Payable Bank Debt Deferred Income Taxes TOTAL LIABILITIES 13,900 5,941 1,254 45,154 14,625 47,432 1,881 86,968 685 30,217 8,023 8,010 5,210 8,018 12,315 Common Stock Add'l Paid in Capital Retained Earnings Currency Adjustments Treasury Stock TOTAL LIABILITIES and EQUITY 23,269 126 (247) 118,140 (236) 43,202 (247) 65,241 12/31/1986 12/31/1987 12/31/1988 BALANCE SHEET RATIOS Current Ratio Quick Ratio Collection Ratio Asset Tumover Days sales in inventory Debt-to-Equity Ratio 1.693 0.982 69.037 2.051 1.177 79.132 2.365 75.674 2.248 4.086 2.256 102.929 1.975 112.867 2.79 77.102 2.327 OPERATIONS RATIOS Receivables turnover Inventory turnover Times interest earned COGS/Sales Gross Margin % Return on equity 5.287 4.734 2.119 60.69% 39.31% 31.49% 4.613 4.823 4.485 55.18% 44.829 35.37% 3.546 3.234 3.435 52.41% 47.59% 35.14% Year 1 Year 2 Current Assets Current Liabilities $640,000 $230,000 $720,000 $482,000 Year 1 Year 2 Total cash, securities, and receivables Total current liabilities $250,000 $122,000 $300,000 $315,000 Year 1 Year 2 Net sales on account Average net receivables $65,000 $37,000 $250,000 $180,000 Year 1 Year 2 Cost of goods sold Average inventory $600,000 $350,000 $1,250,000 $525,000 The Regina Company, Inc. STATEMENT OF INCOME (In Thousands) 12/31/1986 12/31/1987 12/31/1988 (Audited) (Audited) (Audited) 181, Net Sales Cost of Goods Sold Gross Margin 76,144 46,213 29,931 128,234 70,756 57,478 181,123 94,934 86,189 General Expenses Operating Income 20,105 9,826 42,600 14,878 64,285 21,904 Interest Expense Income Taxes Net Income 1,930 3,807 4,089 1,584 6,189 7,105 3,189 7,761 10,954 Earnings Per Share 0.46 0.78 1.21 The Regina Company, Inc. BALANCE SHEET (In Thousands) 12/31/1986 (Audited) 12/31/1987 12/31/1988 (Audited) (Audited) ASSETS Cash Accounts Receivable Inventories Other Current Assets Total Current Assets 14,402 9,762 708 24,935 514 27,801 19,577 1,449 49,341 885 51,076 39,135 3,015 94, 111 Fixed Assets Accumulated Depreciation Other Assets TOTALASSETS 19,523 (3,140) 1,884 43,202 19,736 (4,948) 1,112 65,241 27,884 (6,336) 2,481 118, 140 2,707 UABILITIES AND EQUITY Lines of Credit Current Portion UT Debt Accounts Payable Accrued Liabilities Income Taxes Payable Total Current Liabilities 7,344 3,127 1,554 14,732 900 15,072 5,468 2,619 24,059 1,250 13,288 4,710 3,782 23,030 14,800 Bonds Payable Bank Debt Deferred Income Taxes TOTAL LIABILITIES 13,900 5,941 1,254 45,154 14,625 47,432 1,881 86,968 685 30,217 8,023 8,010 5,210 8,018 12,315 Common Stock Add'l Paid in Capital Retained Earnings Currency Adjustments Treasury Stock TOTAL LIABILITIES and EQUITY 23,269 126 (247) 118,140 (236) 43,202 (247) 65,241 12/31/1986 12/31/1987 12/31/1988 BALANCE SHEET RATIOS Current Ratio Quick Ratio Collection Ratio Asset Tumover Days sales in inventory Debt-to-Equity Ratio 1.693 0.982 69.037 2.051 1.177 79.132 2.365 75.674 2.248 4.086 2.256 102.929 1.975 112.867 2.79 77.102 2.327 OPERATIONS RATIOS Receivables turnover Inventory turnover Times interest earned COGS/Sales Gross Margin % Return on equity 5.287 4.734 2.119 60.69% 39.31% 31.49% 4.613 4.823 4.485 55.18% 44.829 35.37% 3.546 3.234 3.435 52.41% 47.59% 35.14% Year 1 Year 2 Current Assets Current Liabilities $640,000 $230,000 $720,000 $482,000 Year 1 Year 2 Total cash, securities, and receivables Total current liabilities $250,000 $122,000 $300,000 $315,000 Year 1 Year 2 Net sales on account Average net receivables $65,000 $37,000 $250,000 $180,000 Year 1 Year 2 Cost of goods sold Average inventory $600,000 $350,000 $1,250,000 $525,000
Step by Step Solution
There are 3 Steps involved in it
Step: 1

Get Instant Access to Expert-Tailored Solutions
See step-by-step solutions with expert insights and AI powered tools for academic success
Step: 2

Step: 3
Ace Your Homework with AI
Get the answers you need in no time with our AI-driven, step-by-step assistance
Get Started
The Employee Motivation Audit
Authors: Jane Weightman
1st Edition
0955970709, 978-0955970702