

Answered step by step
Verified Expert Solution
Question
1 Approved Answer
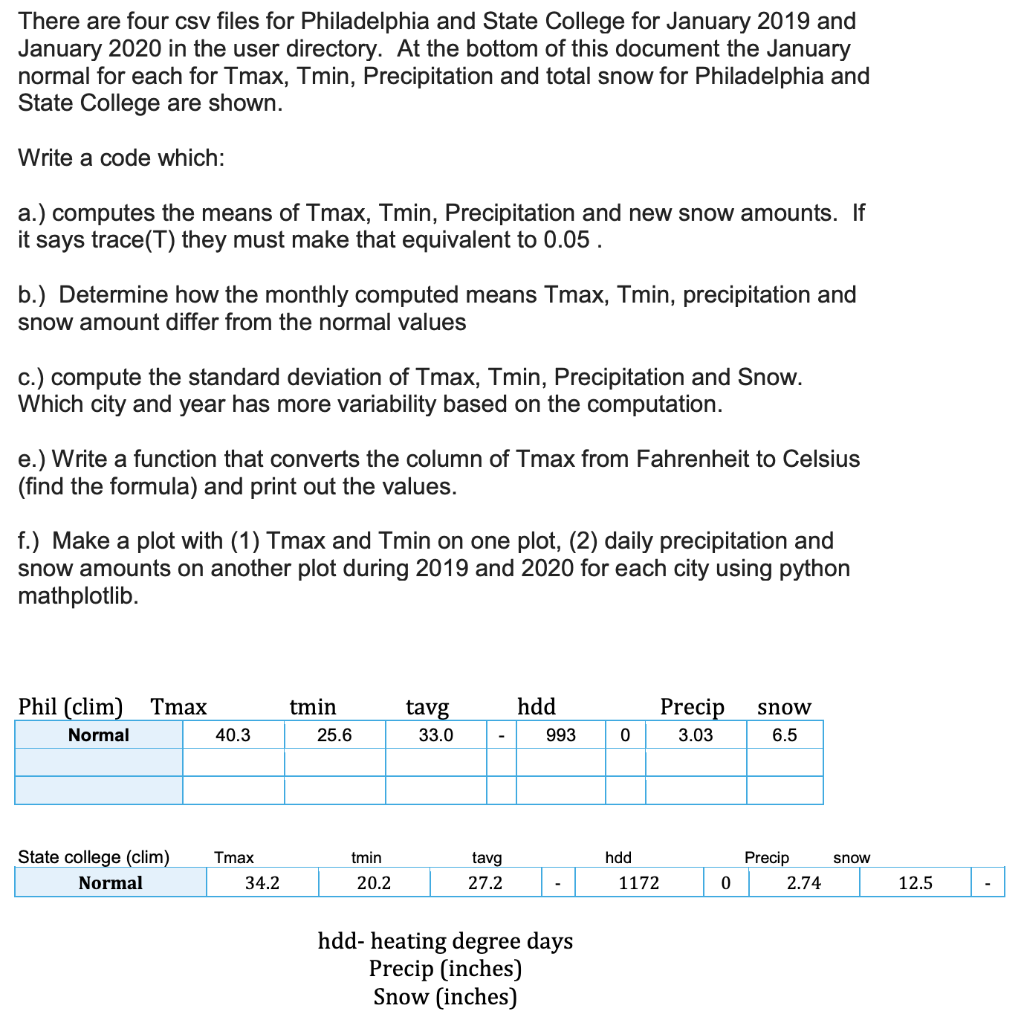
There are four csv files for Philadelphia and State College for January 2019 and January 2020 in the user directory. At the bottom of this
Step by Step Solution
There are 3 Steps involved in it
Step: 1

Get Instant Access to Expert-Tailored Solutions
See step-by-step solutions with expert insights and AI powered tools for academic success
Step: 2

Step: 3
Ace Your Homework with AI
Get the answers you need in no time with our AI-driven, step-by-step assistance
Get Started
Oracle 10g Database Administrator Implementation And Administration
Authors: Gavin Powell, Carol McCullough Dieter
2nd Edition
1418836656, 9781418836658