

Question
there are four different pairs of data (x1 and y1(model1); x2 and y2(model2); x3 and y3(model3); x4 and y4(model4)).Each pair contains an x (the explanatory
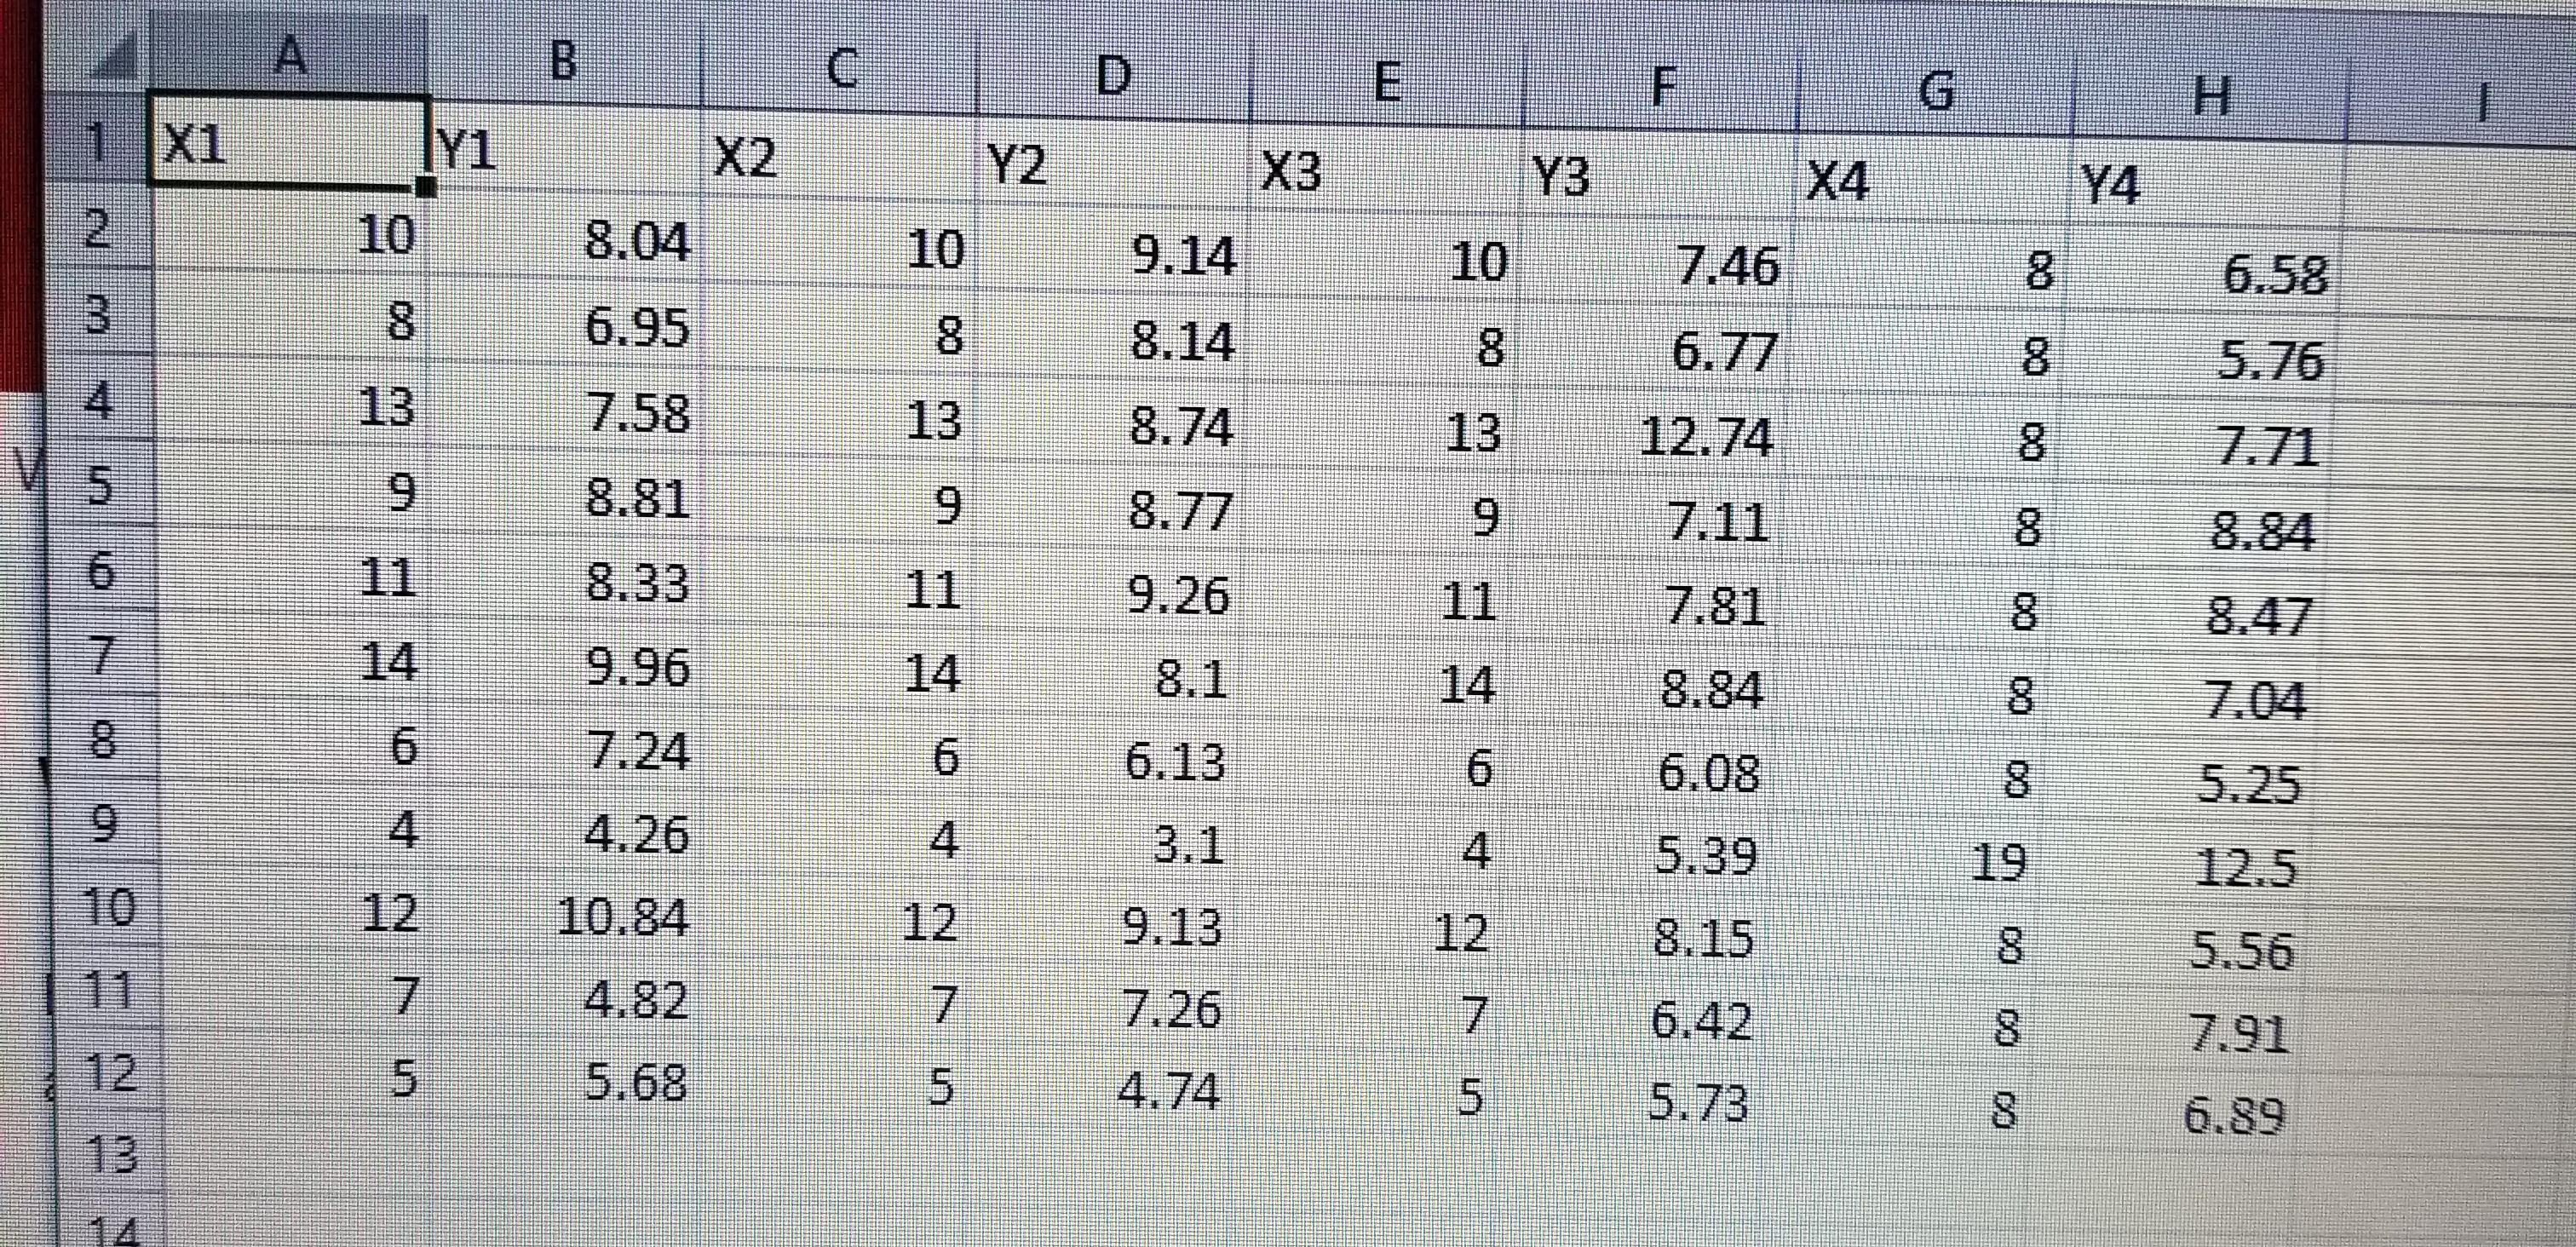
there are four different pairs of data (x1 and y1(model1); x2 and y2(model2); x3 and y3(model3); x4 and y4(model4)).Each pair contains an x (the explanatory variable) and a y (the outcome variable).For each of the pairs, run a simple linear regression using y as the outcome and x as the predictor and answer the following questions:
1.Please record the slope (round to two significant digits after the decimal) of the relationship between x and y and the p value of the parameter estimate for each dataset
Model Slope P value of slope estimate
1 (x1 and y1)
2 (x2 and y2)
3 (x3 and y3)
4 (x4 and y4)
2.Which of the slope estimates is significant at the 5% significance level?
3.What do you notice about the parameter estimates of all of the models?
4.Which of the models most satisfies the four assumptions of simple linear regression when using all of the data points? List all of the assumptions (except independent errors) and briefly explain your evidence that the model satisfies those assumptions. Must include model for full credit.
5.Which of the models most appears to have a curvilinear relationship between y and x?
6.What is the r square of the model from question 5 when a 2nd degree polynomial is fit to the data and how does it compare to the r square of the fitted line?
7.Based on this analysis, why is it important to graph the relationship and test assumptions when using linear regression?
Step by Step Solution
There are 3 Steps involved in it
Step: 1

Get Instant Access to Expert-Tailored Solutions
See step-by-step solutions with expert insights and AI powered tools for academic success
Step: 2

Step: 3
Ace Your Homework with AI
Get the answers you need in no time with our AI-driven, step-by-step assistance
Get Started
Linear Algebra and Its Applications
Authors: David C. Lay
4th edition
321791541, 978-0321388834, 978-0321791542