Answered step by step
Verified Expert Solution
Link Copied!

Question

1 Approved Answer

There are several ways to measure and identify a recession. Read this article: https://www.sunlife.ca/en/tools-and-resources/money-and-finances/managing-your-money/what-is-a-recession-and-what-should-be you-wait/ . Based on the approach empirical mentioned in the article,

There are several ways to measure and identify a recession. Read this article: https://www.sunlife.ca/en/tools-and-resources/money-and-finances/managing-your-money/what-is-a-recession-and-what-should-be you-wait/ . Based on the approach empirical mentioned in the article, search on the Statistics Canada website and download in MS Excel chained quarterly estimates for 2012 (look under the "price" tab on the website StatCan web to find this "chained (2012)" data series in table: 36-10- 0104-01) for the period from the first quarter of 1961 to the last period (use the series which is described as seasonally adjusted) in order to determine for which periods Canada experienced a recession during this period (chained GDP is the new way of defining what the textbook called real GDP). Calculate in the "growth rate" column the quarterly variations in percentage of GDP in the Excel file on the sheet named Q2-Recession. Trace it series showing quarterly percentage change rates and include it in the Excel file on the sheet named Quarterly GDP. Copy and paste this same graph in image format into your working document. Also highlight and identify in this graph the periods for which Canada experienced a recession over this period according to the definition in the article. Use the following chart as a template. You can, if you wish, trace these areas by hand directly on the chart that you copied and pasted into your design document. work before scanning it into PDF format.
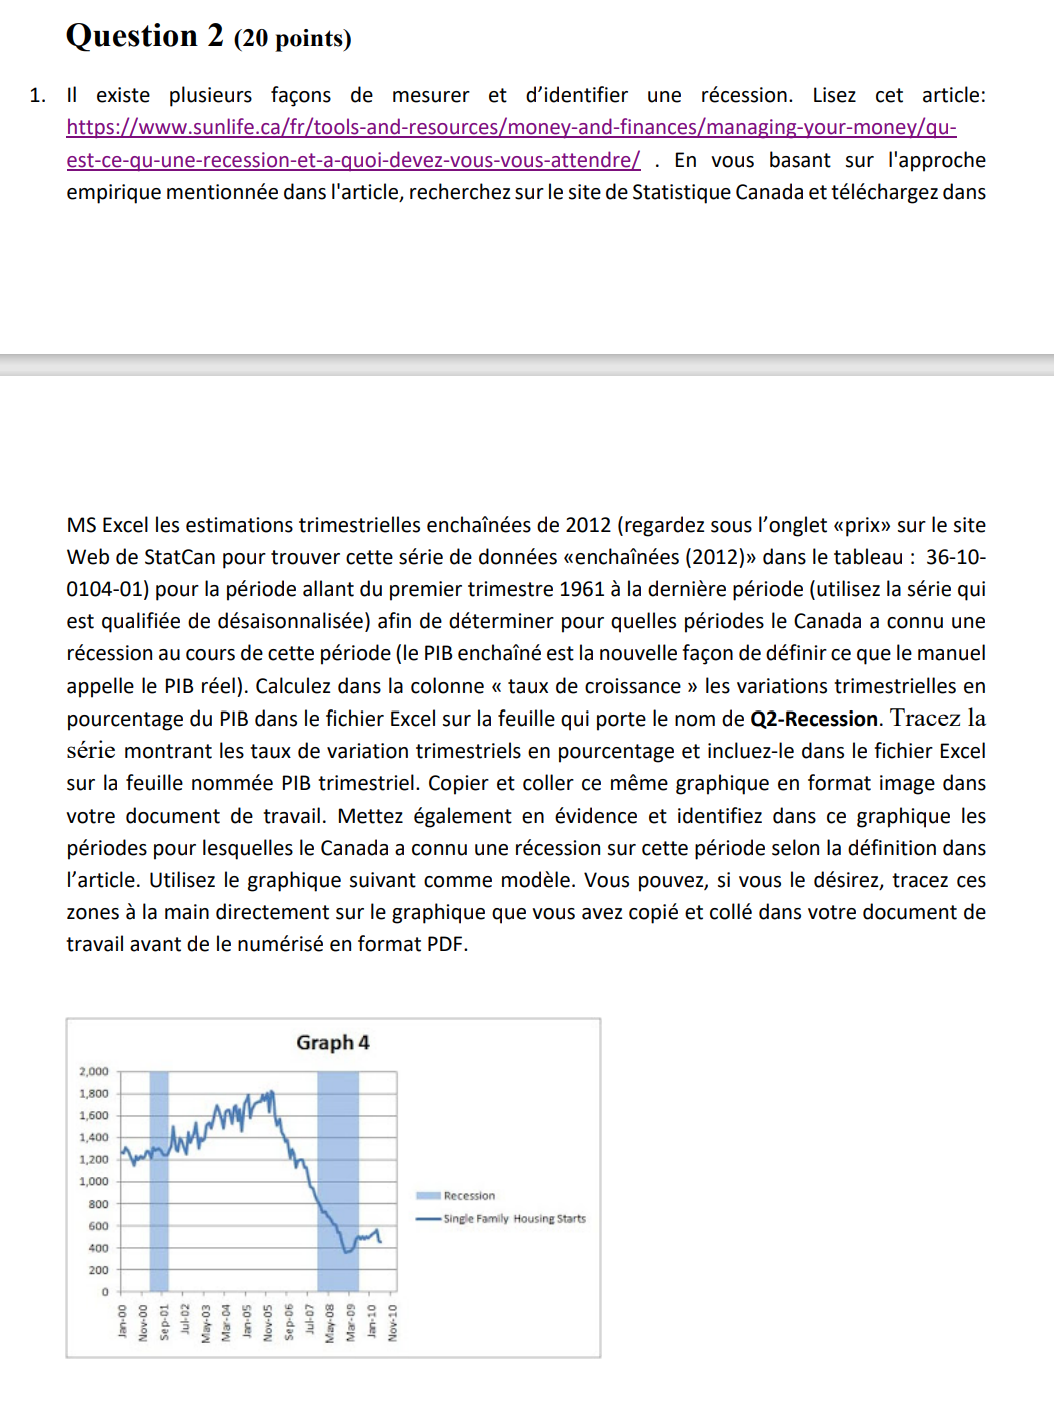
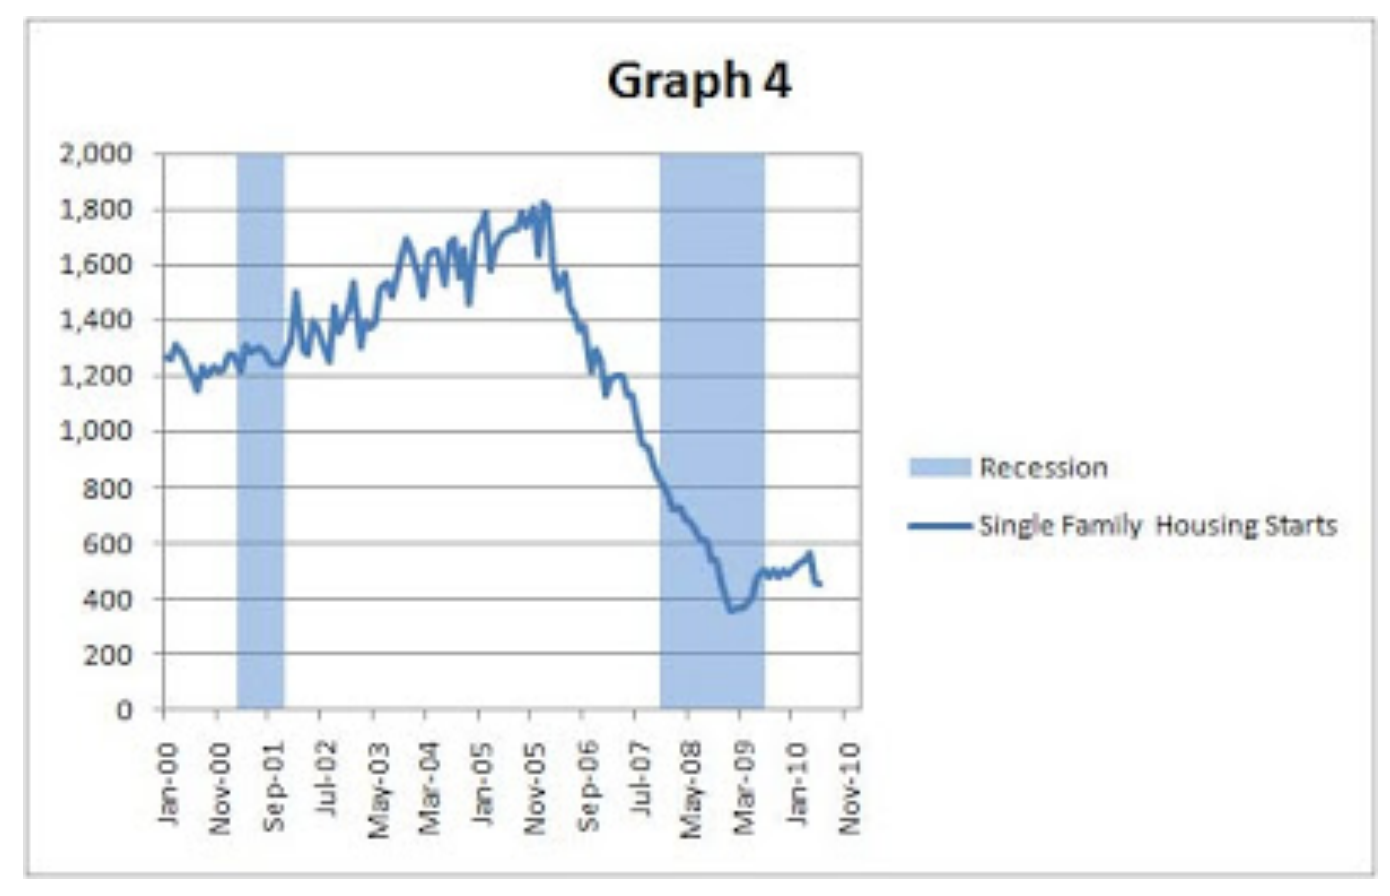
image text in transcribedimage text in transcribed
Question 2 (20 points) 1. Il existe plusieurs facons de mesurer et d'identifier une recession. Lisez cet article: https://www.sunlife.ca/fr/tools-and-resources/money-and-finances/managing-your-money/qu- est-ce-qu-une-recession-et-a-quoi-devez-vous-vous-attendre/ . En vous basant sur l'approche empirique mentionnee dans l'article, recherchez sur le site de Statistique Canada et telechargez dans MS Excel les estimations trimestrielles enchainees de 2012 (regardez sous l'onglet sur le site Web de StatCan pour trouver cette serie de donnees dans le tableau : 36-10- 0104-01) pour la periode allant du premier trimestre 1961 a la derniere periode (utilisez la serie qui est qualifies de desaisonnalisee) afin de determiner pour quelles periodes le Canada a connu une recession au cours de cette periode (le PIB enchaine est la nouvelle facon de definir ce que le manuel appelle le PIB reel). Calculez dans la colonne les variations trimestrielles en pourcentage du PIB dans le fichier Excel sur la feuille qui porte le nom de Q2-Recession. Tracez la serie montrant les taux de variation trimestriels en pourcentage et incluez-le dans le fichier Excel sur la feuille nommee PIB trimestriel. Copier et coller ce meme graphique en format image dans votre document de travail. Mettez egalement en evidence et identifiez dans ce graphique les periodes pour lesquelles le Canada a connu une recession sur cette periode selon la definition dans I'article. Utilisez le graphique suivant comme modele. Vous pouvez, si vous le desirez, tracez ces zones a la main directement sur le graphique que vous avez copie et colle dans votre document de travail avant de le numerise en format PDF. Graph 4 2,000 1,800 1,600 1,400 1,200 1,000 800 Recession 600 - Single Family Housing Starts 400 200 0 an-05 Jul-07 Jul-02 Sep-06 Mar-04 Jan-10 Jan-00 Sep-01 Nov-05 Nov-10 May-03 May-08 Mar-09 Nov-00\f

Step by Step Solution

There are 3 Steps involved in it

Step: 1

blur-text-image

Get Instant Access to Expert-Tailored Solutions

See step-by-step solutions with expert insights and AI powered tools for academic success

Step: 2

blur-text-image

Step: 3

blur-text-image

Ace Your Homework with AI

Get the answers you need in no time with our AI-driven, step-by-step assistance

Get Started

Recommended Textbook for

Managerial Economics and Business Strategy

Authors: Michael R. baye

7th Edition

978-0073375960, 71267441, 73375969, 978-0071267441

More Books

Students also viewed these Economics questions

Question

2. How were various roles filled?

Answered: 1 week ago

Question

LO10.3 Explain how demand is seen by a purely competitive seller.

Answered: 1 week ago