Answered step by step
Verified Expert Solution
Question
1 Approved Answer
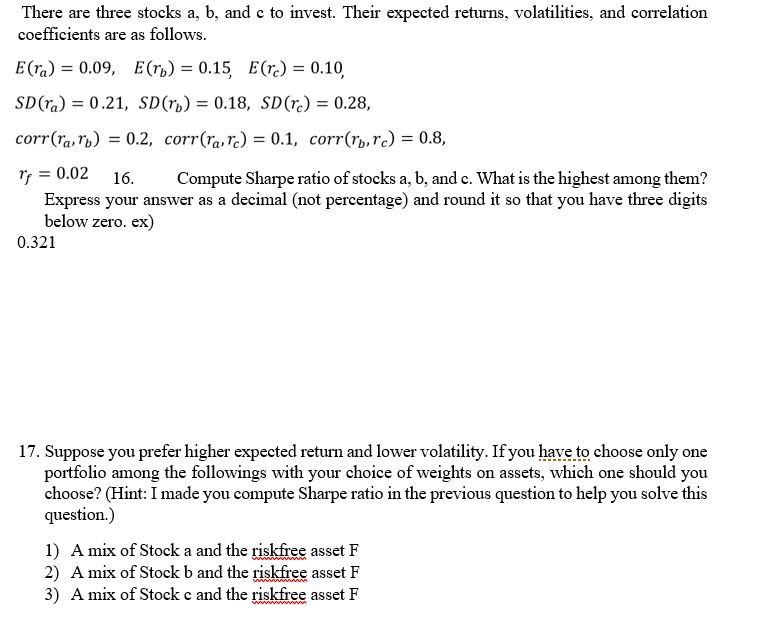
There are three stocks a, b, and c to invest. Their expected returns, volatilities, and correlation coefficients are as follows. E(ra) = 0.09, E(ro) =


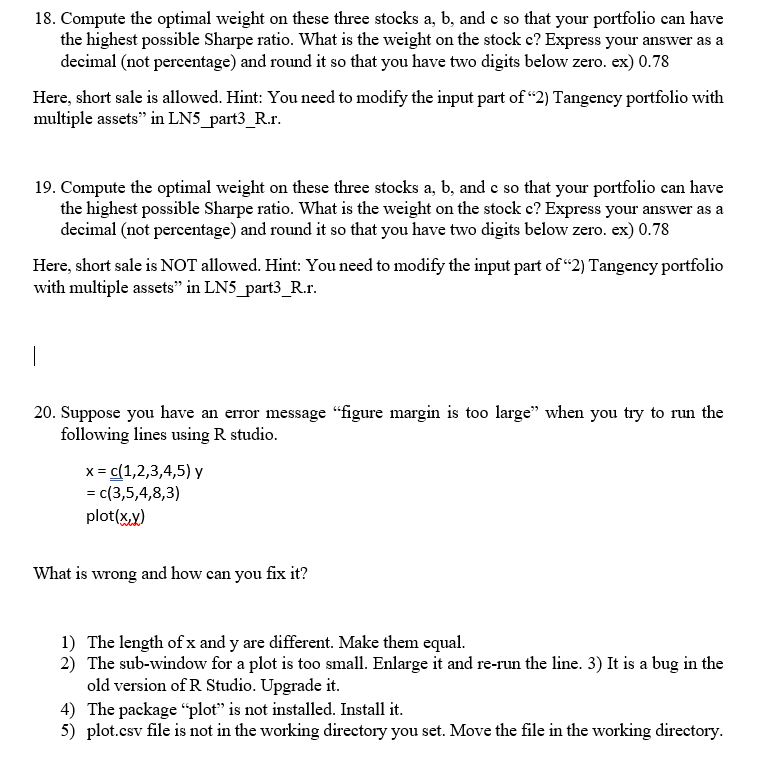
There are three stocks a, b, and c to invest. Their expected returns, volatilities, and correlation coefficients are as follows. E(ra) = 0.09, E(ro) = 0.15, E(r.) = 0.10, SD(ra) = 0.21, SD(ro) = 0.18, SD(rc) = 0.28, corr(raro) = 0.2, corr(rare) = 0.1, corr(rb.rc) = 0.8, r = 0.02 16. Compute Sharpe ratio of stocks a, b, and c. What is the highest among them? Express your answer as a decimal (not percentage) and round it so that you have three digits below zero. ex) 0.321 17. Suppose you prefer higher expected return and lower volatility. If you have to choose only one portfolio among the followings with your choice of weights on assets, which one should you choose? (Hint: I made you compute Sharpe ratio in the previous question to help you solve this question.) 1) A mix of Stock a and the riskfree asset F 2) A mix of Stock b and the riskfree asset F 3) A mix of Stock c and the riskfree asset F 18. Compute the optimal weight on these three stocks a, b, and c so that your portfolio can have the highest possible Sharpe ratio. What is the weight on the stock c? Express your answer as a decimal (not percentage) and round it so that you have two digits below zero. ex) 0.78 Here, short sale is allowed. Hint: You need to modify the input part of 2) Tangency portfolio with multiple assets in LN5_part3_R.r. 19. Compute the optimal weight on these three stocks a, b, and c so that your portfolio can have the highest possible Sharpe ratio. What is the weight on the stock c? Express your answer as a decimal (not percentage) and round it so that you have two digits below zero. ex) 0.78 Here, short sale is NOT allowed. Hint: You need to modify the input part of 2) Tangency portfolio with multiple assets" in LN5_part3_R.r. 20. Suppose you have an error message "figure margin is too large when you try to run the following lines using R studio. x = c(1,2,3,4,5) = c(3,5,4,8,3) plot(x,y) What is wrong and how can you fix it? 1) The length of x and y are different. Make them equal. 2) The sub-window for a plot is too small. Enlarge it and re-run the line. 3) It is a bug in the old version of R Studio. Upgrade it. 4) The package "plot" is not installed. Install it. 5) plot.csv file is not in the working directory you set. Move the file in the working directory. There are three stocks a, b, and c to invest. Their expected returns, volatilities, and correlation coefficients are as follows. E(ra) = 0.09, E(ro) = 0.15, E(r.) = 0.10, SD(ra) = 0.21, SD(ro) = 0.18, SD(rc) = 0.28, corr(raro) = 0.2, corr(rare) = 0.1, corr(rb.rc) = 0.8, r = 0.02 16. Compute Sharpe ratio of stocks a, b, and c. What is the highest among them? Express your answer as a decimal (not percentage) and round it so that you have three digits below zero. ex) 0.321 17. Suppose you prefer higher expected return and lower volatility. If you have to choose only one portfolio among the followings with your choice of weights on assets, which one should you choose? (Hint: I made you compute Sharpe ratio in the previous question to help you solve this question.) 1) A mix of Stock a and the riskfree asset F 2) A mix of Stock b and the riskfree asset F 3) A mix of Stock c and the riskfree asset F 18. Compute the optimal weight on these three stocks a, b, and c so that your portfolio can have the highest possible Sharpe ratio. What is the weight on the stock c? Express your answer as a decimal (not percentage) and round it so that you have two digits below zero. ex) 0.78 Here, short sale is allowed. Hint: You need to modify the input part of 2) Tangency portfolio with multiple assets in LN5_part3_R.r. 19. Compute the optimal weight on these three stocks a, b, and c so that your portfolio can have the highest possible Sharpe ratio. What is the weight on the stock c? Express your answer as a decimal (not percentage) and round it so that you have two digits below zero. ex) 0.78 Here, short sale is NOT allowed. Hint: You need to modify the input part of 2) Tangency portfolio with multiple assets" in LN5_part3_R.r. 20. Suppose you have an error message "figure margin is too large when you try to run the following lines using R studio. x = c(1,2,3,4,5) = c(3,5,4,8,3) plot(x,y) What is wrong and how can you fix it? 1) The length of x and y are different. Make them equal. 2) The sub-window for a plot is too small. Enlarge it and re-run the line. 3) It is a bug in the old version of R Studio. Upgrade it. 4) The package "plot" is not installed. Install it. 5) plot.csv file is not in the working directory you set. Move the file in the working directory
Step by Step Solution
There are 3 Steps involved in it
Step: 1

Get Instant Access to Expert-Tailored Solutions
See step-by-step solutions with expert insights and AI powered tools for academic success
Step: 2

Step: 3

Ace Your Homework with AI
Get the answers you need in no time with our AI-driven, step-by-step assistance
Get Started


